


[Editor’s note: As of November 2022, we no longer use Slack, and we’re happy to share that we’ve moved to Circle for our new community platform. We will be continuing Q&As, live discussions and more in this new community platform. If you’re a member and not a part of our Circle community yet, you can click the link at the end of the article to join.]
In this HW+ Slack Q&A, HousingWire Lead Analyst Logan Mohtashami gives a small preview of the upcoming Housing Update webinar and what he will be focusing on during the discussion. If you have not registered for the Housing Update webinar that’s set for May 10th, please go here.
As a member of HW+, you get access to 30-minute Slack Q&As, where we invite the HW Media newsroom to break down the hottest topics in the industry. This Q&A was hosted in the HW+ Slack channel, which is exclusively available to members. To get access to the next Q&A on May 20th, you can join HW+ here.
The following Q&A has been lightly edited for length and clarity. This Q&A was originally hosted on May 4.
HousingWire: We started our last session talking about purchase data and its moving parts, so Logan, how is demand holding up?
Logan Mohtashami: One thing that has surprised me so far in 2022 is that demand is holding up better than I thought. I am a big believer in purchasing application data on a year-over-year basis. Typically I put the most weight on this index from the 2nd week of January to the first week of May. After May, total volumes fall. So far this year, with the rise in mortgage rates, it is still trending better than I thought it would have with rates over 5%.
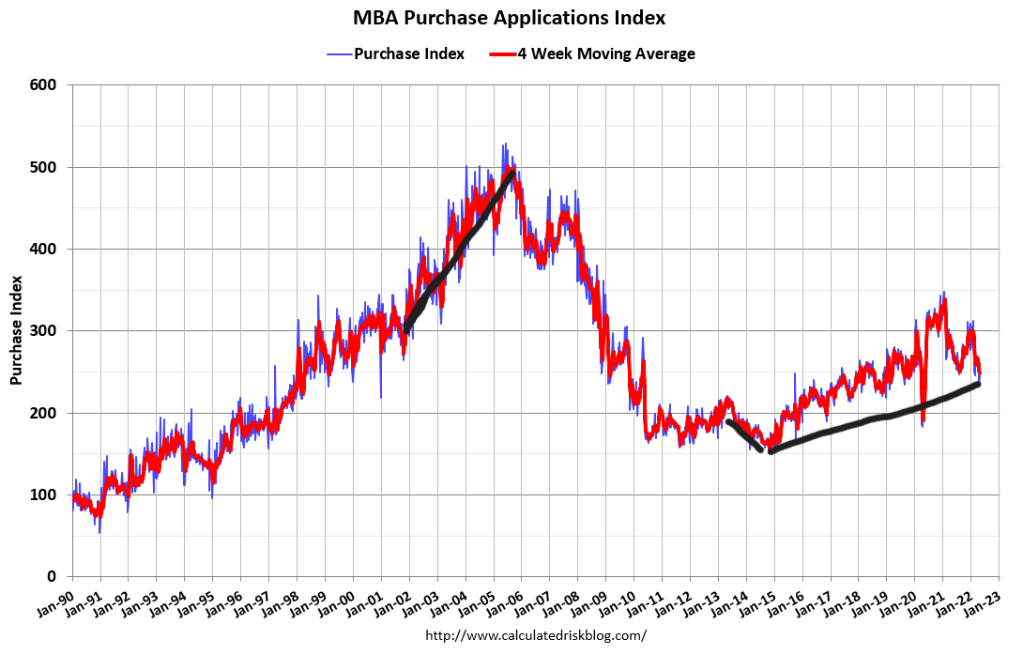
So, let’s take a look at where we are at, and remember; this data line looks out 30-90 days, so it’s a great forward-looking inductor Purchase application data:
+ 4 % week to week
– 11% year over year
– 12% on 4-week moving average year over year
This data line has been negative year over year since June 2021. However, that was due to Covid-19 high comps that ended in February of this year.
Some historical references:
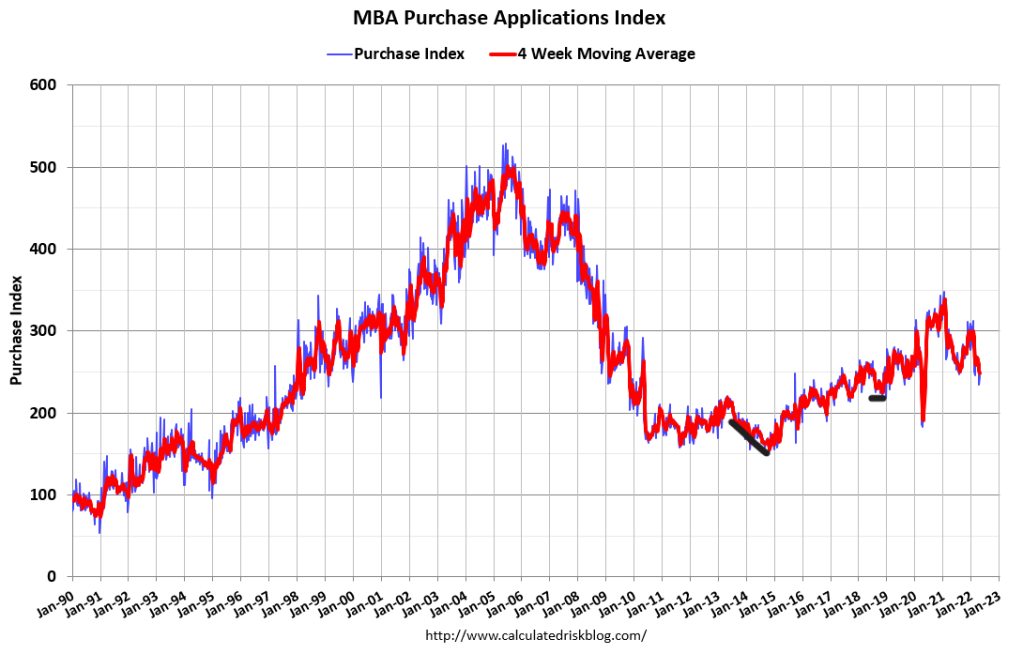
In the last two periods when rates rose; in 2013/2014, purchase application data was negative — by 20% year over year on-trend. In 2018 purchase application data was flat to slightly positive all year long; we only had three mild negative years over year prints when rates headed to 5%.
Sales trends always fall when rates rise, as we can see below. The sales data we have had already this year is backward-looking. So, expect the sales trend to drop some more. However, purchase application data is doing better than I thought by 6%-10% YoY.
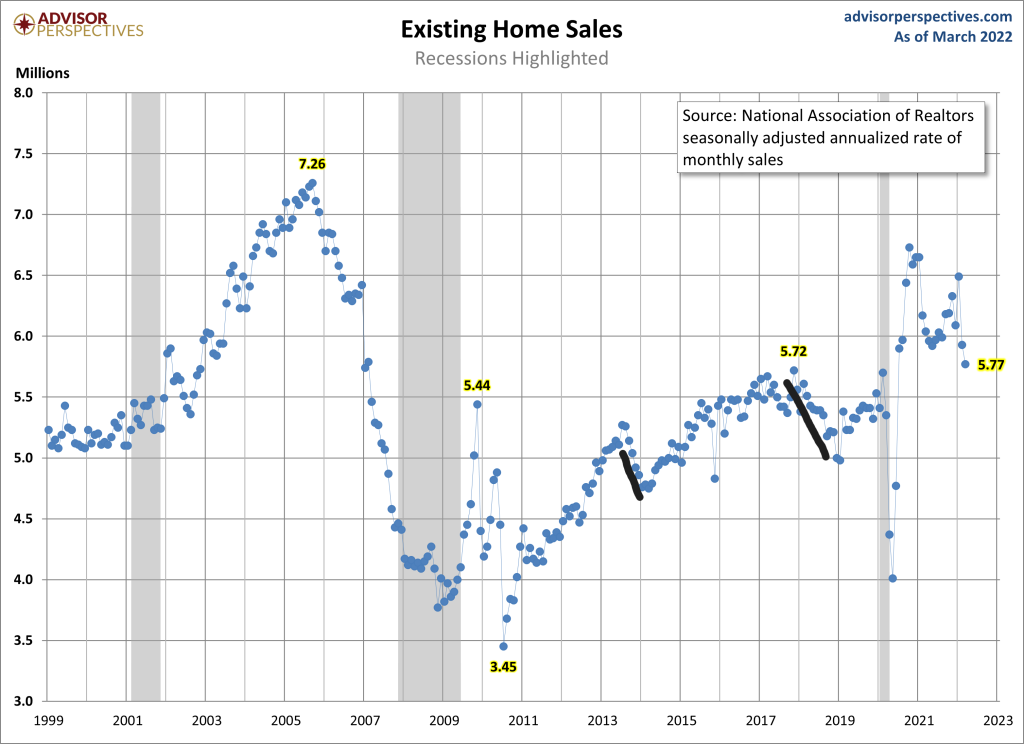
A good rule of thumb is that when this data line shows weakness or strength more prominently, it’s up 20%-30% or down 20%-30% on-trend. We haven’t seen that yet; the -12% YoY decline is a noticeable weakness, but nothing too dramatic yet like what we saw from 2005-to 2008.
During the Covid-19 weakness and recovery phase, we saw negative 25%-33% year-over-year prints, and the recovery saw some positive 25%-33% prints. This data line is trend survey data. 2022 will be the first actual negative purchase application data year since 2014.
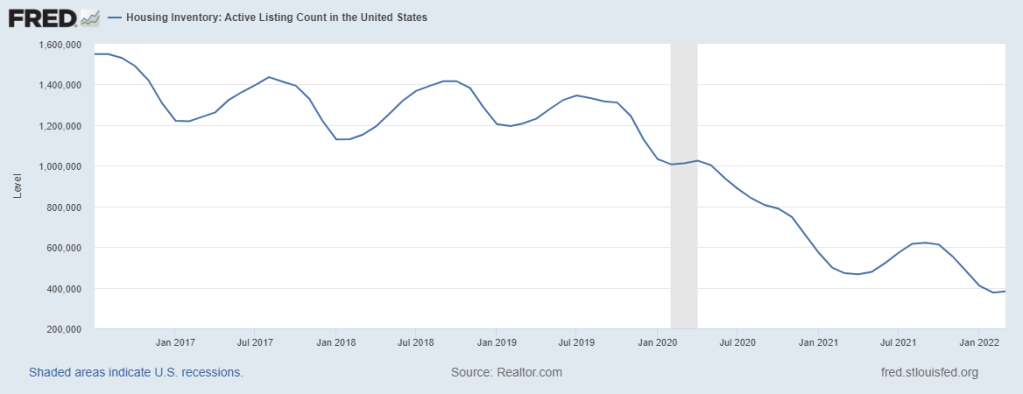
HousingWire: Will inventory finally break the streak and be positive year over year?
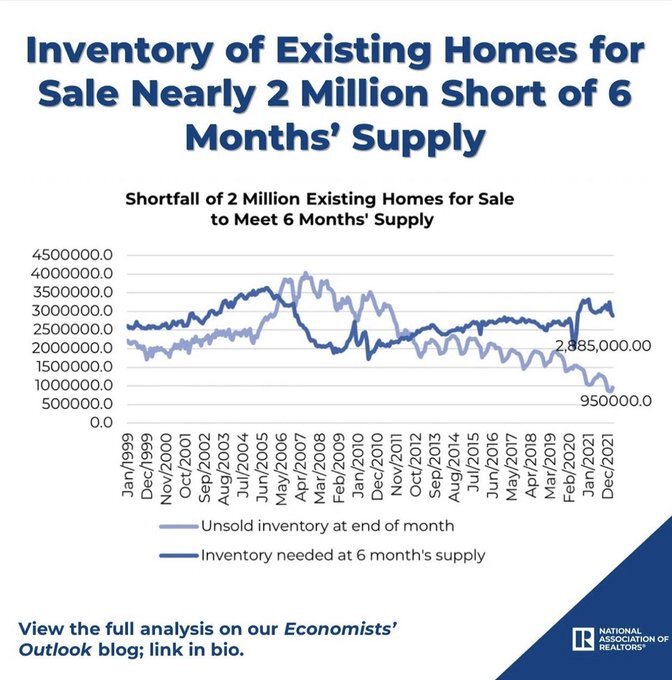
Logan Mohtashami: The year-over-year inventory trends will finally show some positive prints in the upcoming weeks. Higher rates are doing what they usually do, they create more days on the market, which allows inventory to grow.
The big difference now compared to the last time rates rose and created more inventory is that inventory levels were a lot higher back in 2014 than where we are today in 2022.
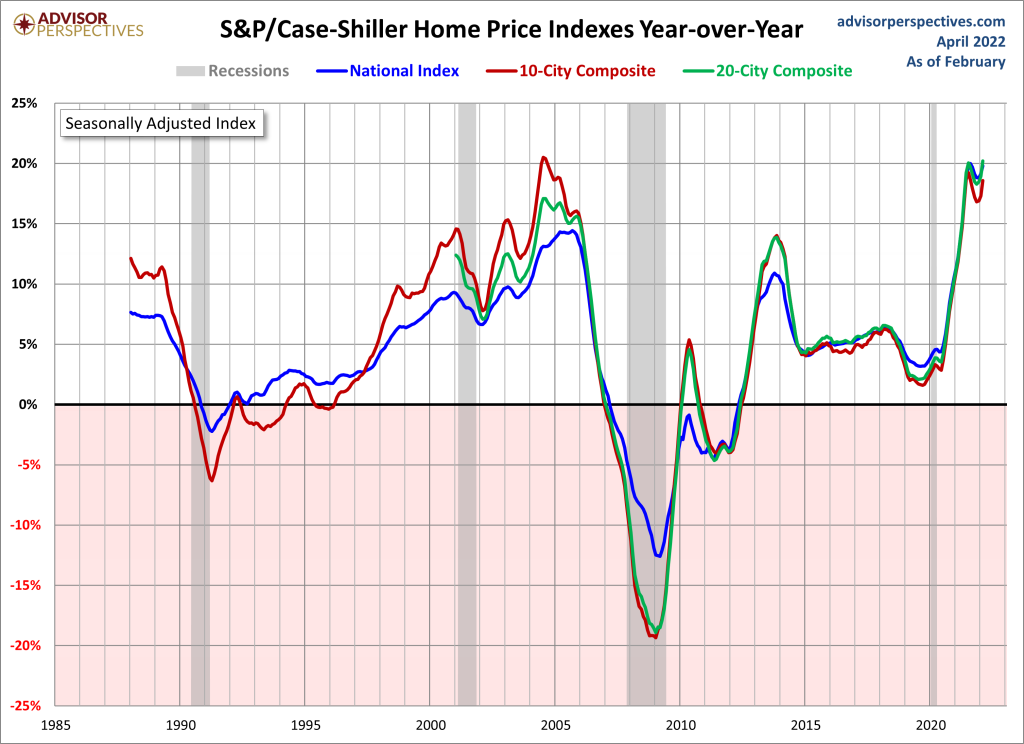
However, we will take what we can get because home prices were running way too hot in 2022.
While we are still far away from 2018/2019 levels of total inventory, anything, and I mean anything, we get is a plus now.
HousingWire: What is the biggest risk to your balance housing market take?
Logan Mohtashami: The most significant risk to my balance housing market take is that the economy starts to show some real weakness, and the inflationary data rate of growth begins to fall. Then the bond market will sniff this out and send bond yields lower, which means mortgage rates will fall.
This has always been the case in the past. Europe’s economy is slowing down. China’s economy is in a mess with its lockdowns, Russia is in a recession, and Japan’s economy still lacks the Tourism it needs. So, the U.S. once again is holding the world up. However, we see some cracks, and 3 out of 6 recession red flags are up, with the 4th one identified.
The last two big ones for my recession flags:
- Leading economic index falls 4-6 months before a recession; so far, it’s just pausing here, No noticeable declines.
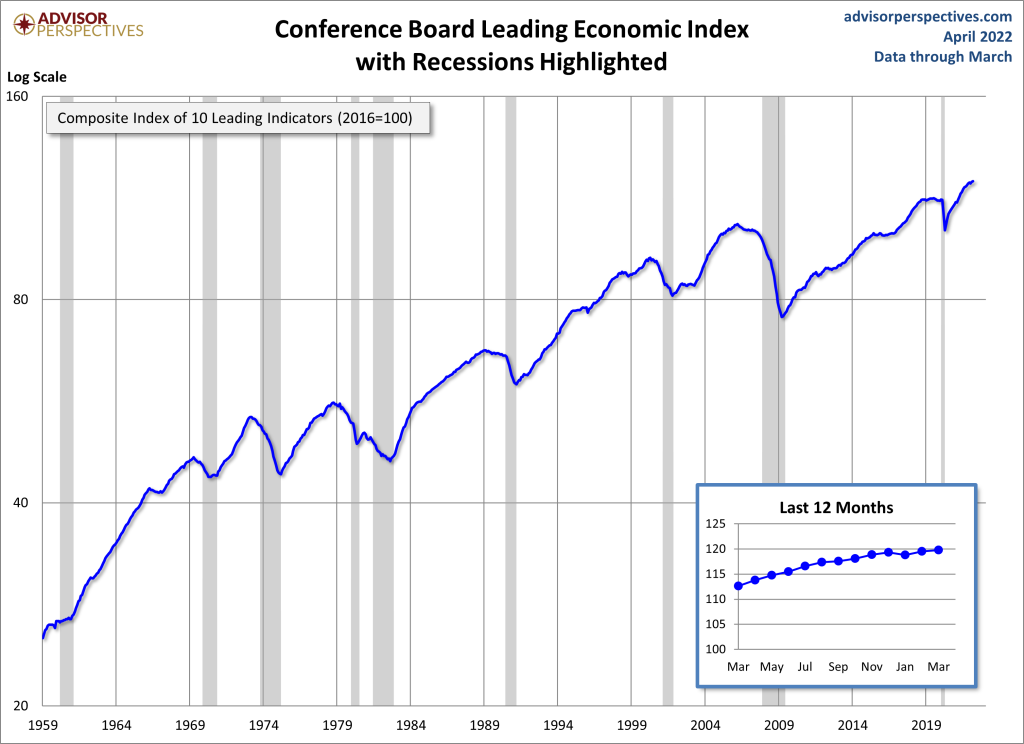
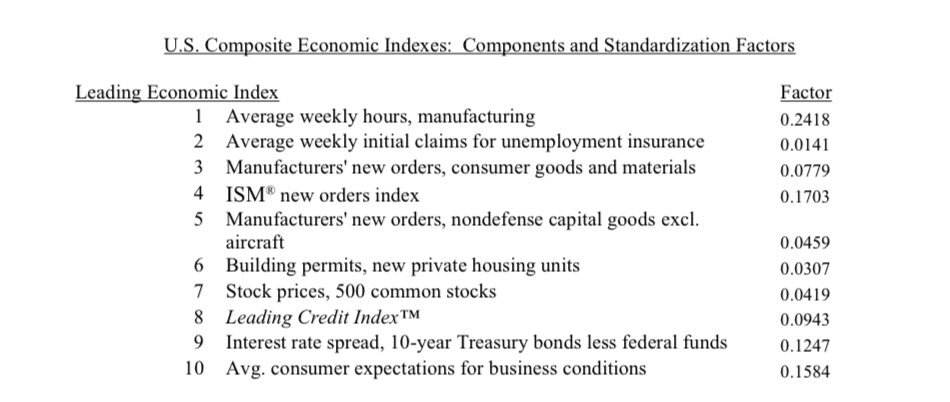
For all the nerds out there, here are the components of the leading economic index.
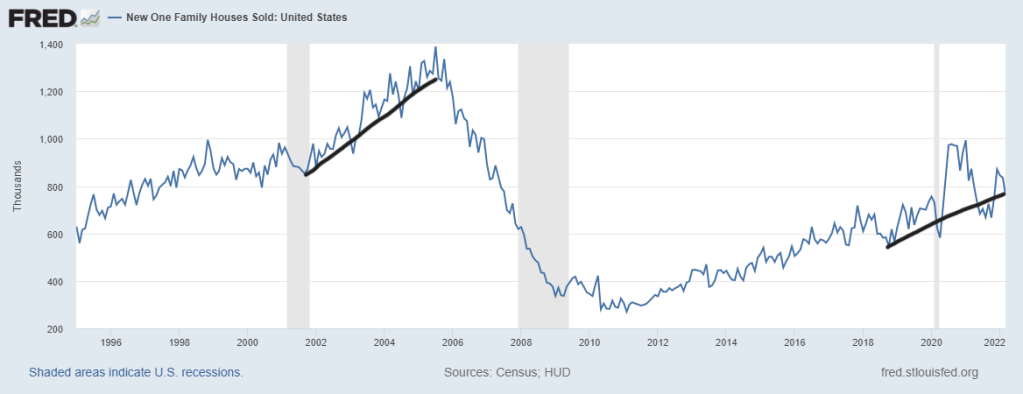
- New home sales fall, which will create a slowdown in housing construction. So far, this hasn’t happened yet, but this is something to keep an eye out for for the rest of the year.
HousingWire: What are some of the key points that you think will be the hot topic for the housing update event happening on May 10th?
Logan Mohtashami: For the May economic forecast event, I will be focusing more on forward-looking indicators and how they should work with the inventory channels. Once mortgage rates rose after the price gains we had in 2020-2021 and 2022, we should have a shift in the housing market, and I believe we have to look at the forward-looking indicators.
Take full advantage of your HW+ membership and join our exclusive Circle platform dedicated only to HW+ Members! To join the community, go here.

