
We created the weekly Housing Market Tracker because housing data has been so wild since 2020. The housing market madness persisted last week as inventory fell and higher mortgage rates took a bigger bite out of purchase application data.
Here is a quick rundown from last week:
- Purchase applications fell 18% week to week and hit levels not seen since 1995.
- Weekly housing inventory decreased by 6,801, while new listing data is still negative year-over-year.
- The 10-year yield didn’t let up this last week, as more robust economic and inflation data kept levels elevated and pushed mortgage rates higher.
Purchase application data
There is no way around this story; we had a solid streak from Nov. 9, 2022 to February of this year, when the purchase application data was trending positively as mortgage rates fell from 7.37% to 5.99%. Then rates went up almost 1% over several weeks, completely reversing the gains.
The 12 weeks of positive purchase application data are now in the system, and people who applied for a loan are looking and buying. How does the sharp increase in rates directly impact those homebuyers? Some who recently applied for a mortgage were looking to buy as rates fell, but now they may hold off purchasing until rates cool off again.
I call this rate lock risk, where some buyers don’t qualify or don’t want to continue the purchase until rates fall again. Rates spiking almost 1% in mere weeks is damaging because it can take some previous buyers out of play.
On top of that, the forward-looking purchase apps have been impacted negatively. As seen in the index below, we have returned to levels last seen in 1995.
The last two weeks in purchase apps look out 30-90 days. Some homebuyers have bought a home, which will show up in the upcoming sales data, as we saw a positive number in today’s pending home sales report. However, with the negative purchase application data, we have lost the continuous positive streak that started on Nov. 9.
Last week on CNBC I said I wasn’t surprised that new home sales data did better than anticipated, and we should see better existing home sales data in the next report. However, the positive trend story changed in the last two weeks, and it’s hard to get more stability when rates move up and down this much.

So, now we will have to track the sales data more closely to see whether some buyers didn’t end up pulling the trigger and if they come back later in the year if rates fall back to 6%.
Weekly housing inventory
Traditionally, weekly housing inventory bottoms in January and we see a regular rise in the spring and summer, then a fade in the fall and winter. Post-2020, inventory has been bottoming out later in the year, and I have a working theory on this. We have had three abnormal events in housing since 2020 that have all happened toward the end of the year, which has moved the timeline for the seasonal bottom in housing inventory.
Continuing with that theme, inventory has fallen again this week by 6,801, but we should be getting closer to the seasonal bottom. On a good note, however, inventory is higher than last year, which contributed to the savagely unhealthy housing market.
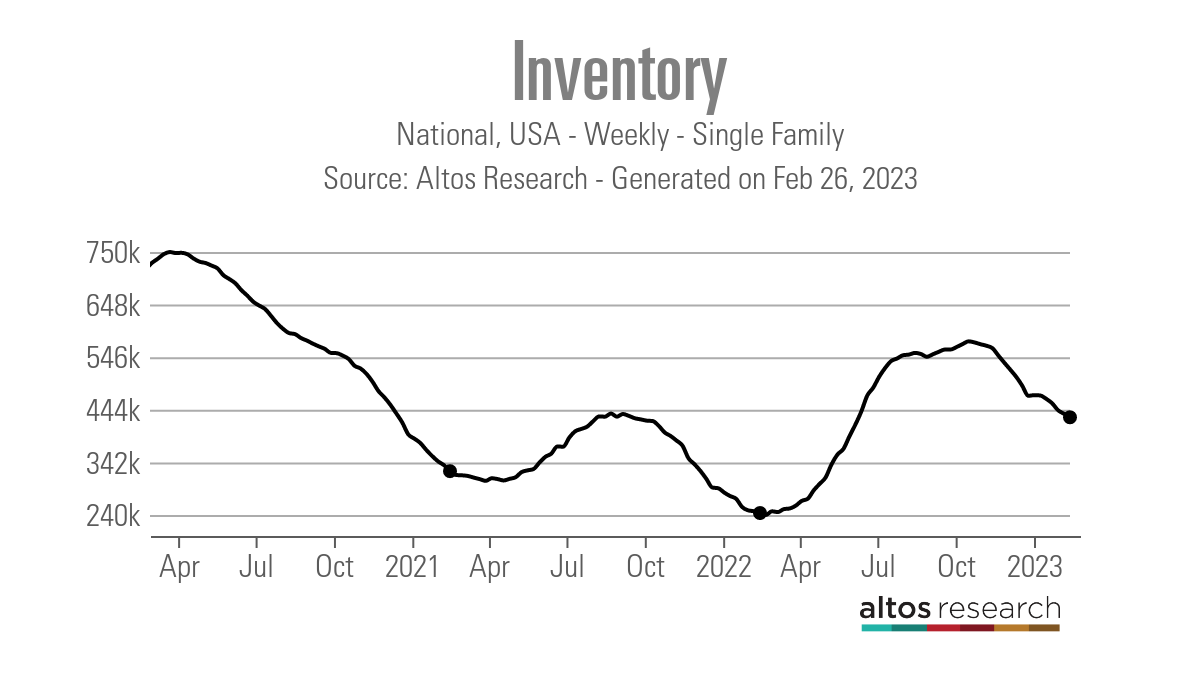
- Weekly inventory change (Feb. 10-Feb. 17): Fell from 436,558 to 429,757
- Same week last year (Feb.11-18): Fell from 247,385 to 243, 916
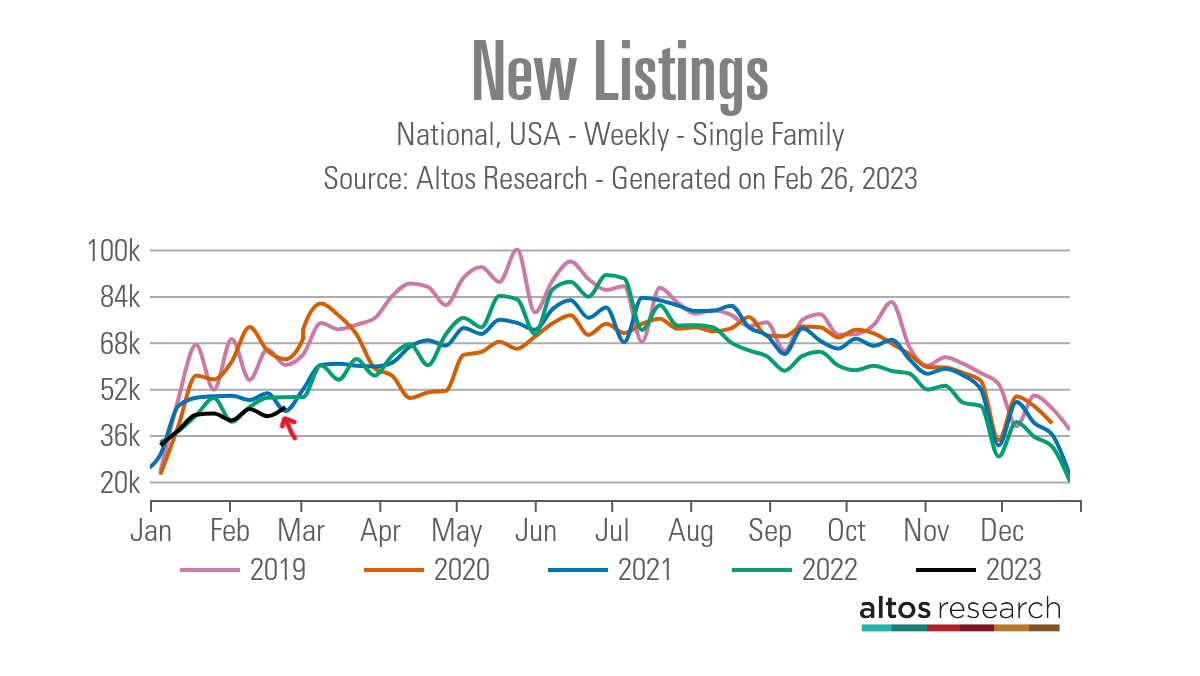
Another storyline with inventory is taking hold now, and new listing growth once again is negative year over year. After mortgage rates spiked above 6% last year, fewer and fewer people have been listing their homes for sale. I had hoped that lower mortgage rates would get more people to sell their homes, but this wasn’t the case and now we are dealing with much higher rates.
The one good sign is that even though we are below 2022 inventory levels year over year, we are higher than in 2021. However, we are noticeably down from the 2019 levels.
Inventory levels:
- 2019 – 60,453
- 2020 – 69,464
- 2021 – 44,533
- 2022 – 49,324
- 2023 – 45,918
For more historical perspective, in 2015 and 2016, new listing data for the same week averaged 76,913 with the two years combined, so being at 45,918 is low. The red arrow on the chart below shows how low inventory is relative to other years.
A traditional seller is a conventional buyer most of the time. In 2021, mortgage rates were low enough to keep demand much higher than it is today. Last year, rates started to rise, but they still needed to get above 4% to change housing dynamics. However, there is one bit of good news here.
In a typical marketplace, the days on market are more than 30 days. Last week, the existing home sales report showed — for the first time in a long time — that days on the market are over 30 days. This is a key indicator and one reason the housing market is no longer savagely unhealthy.
So while inventory and the new listing data aren’t much to talk about, one thing I truly believe is that if the days on market can grow, then inventory can accumulate higher. This was very hard to do with the days on the market being under 20 days, hence why we aren’t back to 2019 levels as a country. However, if the new listings take longer to sell, we can return to 2019 inventory levels in time.
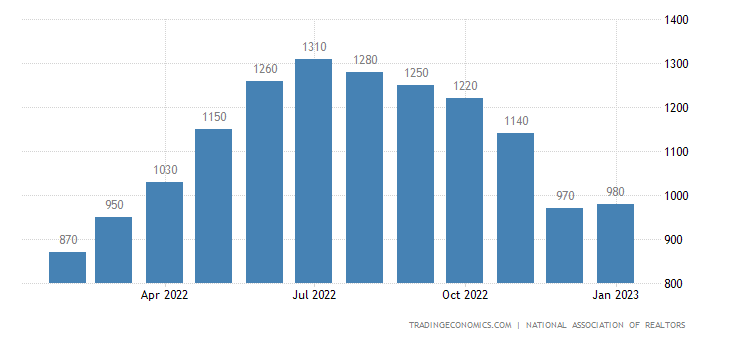
NAR: Total Inventory levels are 980,000.
My 2023 forecast, where I lay out the case for inventory to reach 2019 levels, is running into a lot of trouble because of a lack of new listing growth. The days on market getting over 30 days and staying above that level is the only shot I have to be right this year and all it takes is to break over 1.52 million to reach 2019 levels.


While 2019 levels were at a four-decade low before COVID-19, we had a more functional housing market than we have experienced post-COVID-19.
10-year yield and mortgage rates
In my 2023 forecast, if the economy stayed firm, my 10-year yield range would be between 3.21% and 4.25%, equating to mortgage rates in a range of 5.75% to 7.25%.
The bond market tried to make a break under 3.42% on the 10-year yield, which I thought would be hard to do. It has failed to do that three times recently and now it is testing a break to a higher level. The back-and-forth action on the 10-year yield looks about right, considering the economy is still in expansion mode and the labor market is still solid.
Now If the economy breaks sooner than I anticipate, we could go under that 3.21% on the 10-year yield. Mortgage rates should get to 5.25% with a 10-year yield of 2.73%. This assumes the spreads are still vast. If they aren’t, then mortgage rates could go even lower.
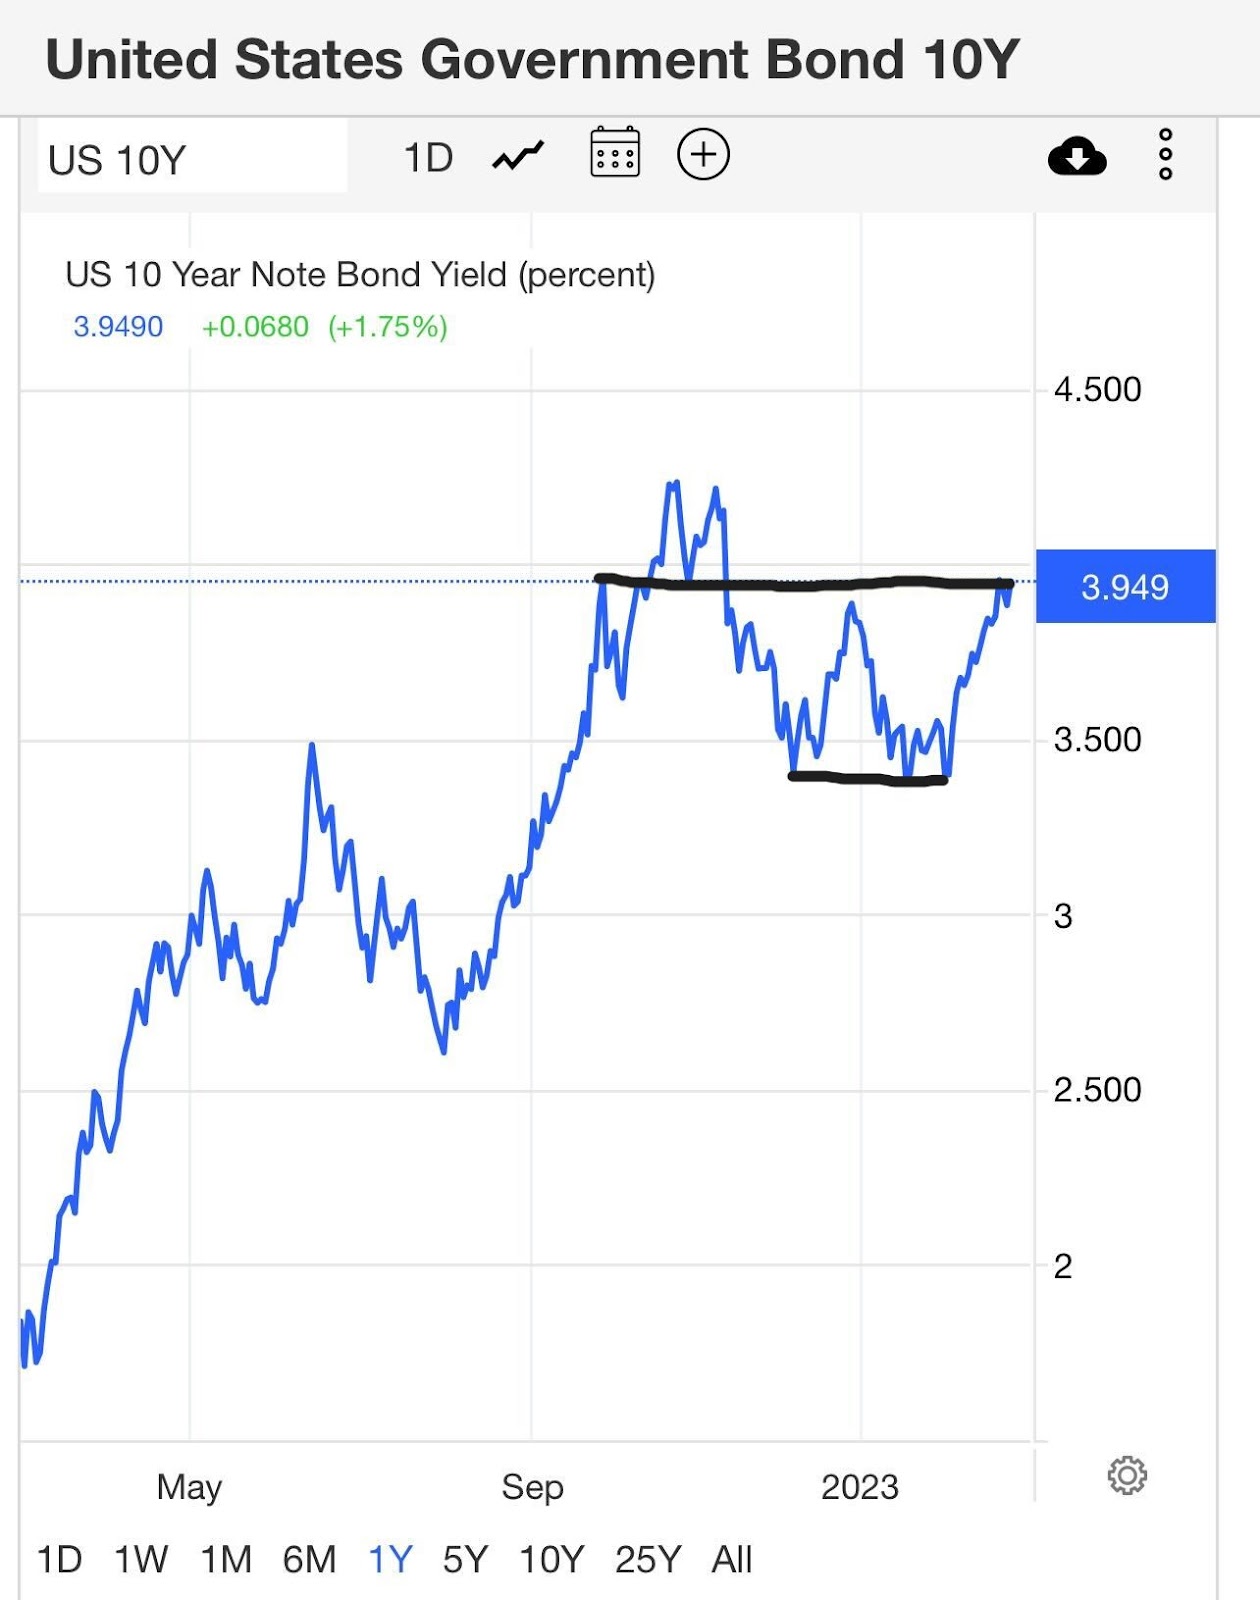
I’m not a Fed pivot person, so I don’t believe the Federal Reserve members will publicly discuss cutting rates soon. This is why I didn’t believe the 10-year yield would break under 3.21% early in the year. For mortgage rates to go below 5.75%, we would need economic data to get weaker, and that has not happened so far in 2023.
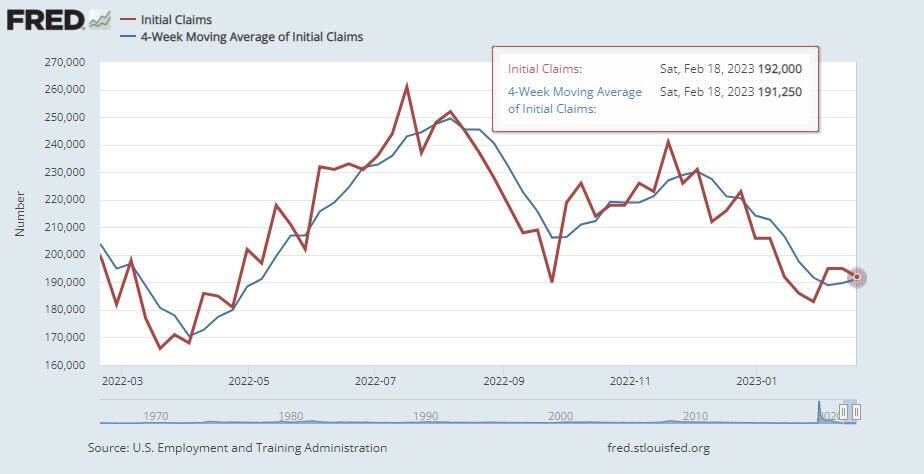
Last week we saw stronger economic data, and bond yields stayed elevated the entire week. My Fed pivot rule, which means the bond market will get way ahead of the Fed when this happens, is that the jobless claims data needs to break over 323,000 on the 4-week moving; we are still under 200K on the weekly headline prints.
Now, the Fed will pivot at some point in the future. However, it needs the labor market to break because it believes the best way to fight inflation is for the labor market to get much softer. My target level for this is when the jobless claims break over 323,000 on the four-week moving average.
When that data line weakens, the bond market will get ahead of the Federal Reserve and send the 10-year yield lower. However, as we can see below, jobless claims are still below 200,000.
Oddly enough, everything looks about right to me regarding the 10-year yield range. If the 10-year yield had broken under 3.21% early in the year with the stronger economic data we have seen I would have been wrong in my forecast call. However, the data has stayed firm, and yield has yet to break under 3%.
The week ahead
There is less on the calendar this week for key economic data. We had pending home sales today, and we have the FHFA Home Price Index and the S&P CoreLogic, Case-Shiller home price index this week, plus a few manufacturing reports and durable goods orders.
Last week the economic data came in much better than anticipated and specifically the inflation data was stronger in this report than in the previous months. Jobless claims will always be a key report every Thursday, but the big labor data is coming out next week.
Higher mortgage rates have zapped the purchase application data, which ran well for a few months. If mortgage rates stay near 7%, it will be interesting to see if more people skip another year of listing their homes to sell — this would not be a positive for the housing market because this limits inventory growth and demand at the same time.
I understand this is a first-world problem, which means we have some pent-up demand when rates fall, especially below 5.75%. However, I prefer a bigger inventory buffer for that day than what we have today in America.

Until then, I’m hoping to see the housing market get back to some form of balance, and we’ve already gotten the first step — getting the days on the market back over 30 days.

