


Today, the Bureau of Labor Statistics reported that the United States Of America created 678,000 jobs in February. We also had 92,000 in positive revisions, and this report was a beat of estimates coming off a strong January report as well. The U.S unemployment rate stands at 3.8%, and we are getting closer and closer to my September 2022 forecast of getting all the jobs back that we lost due to COVID-19.
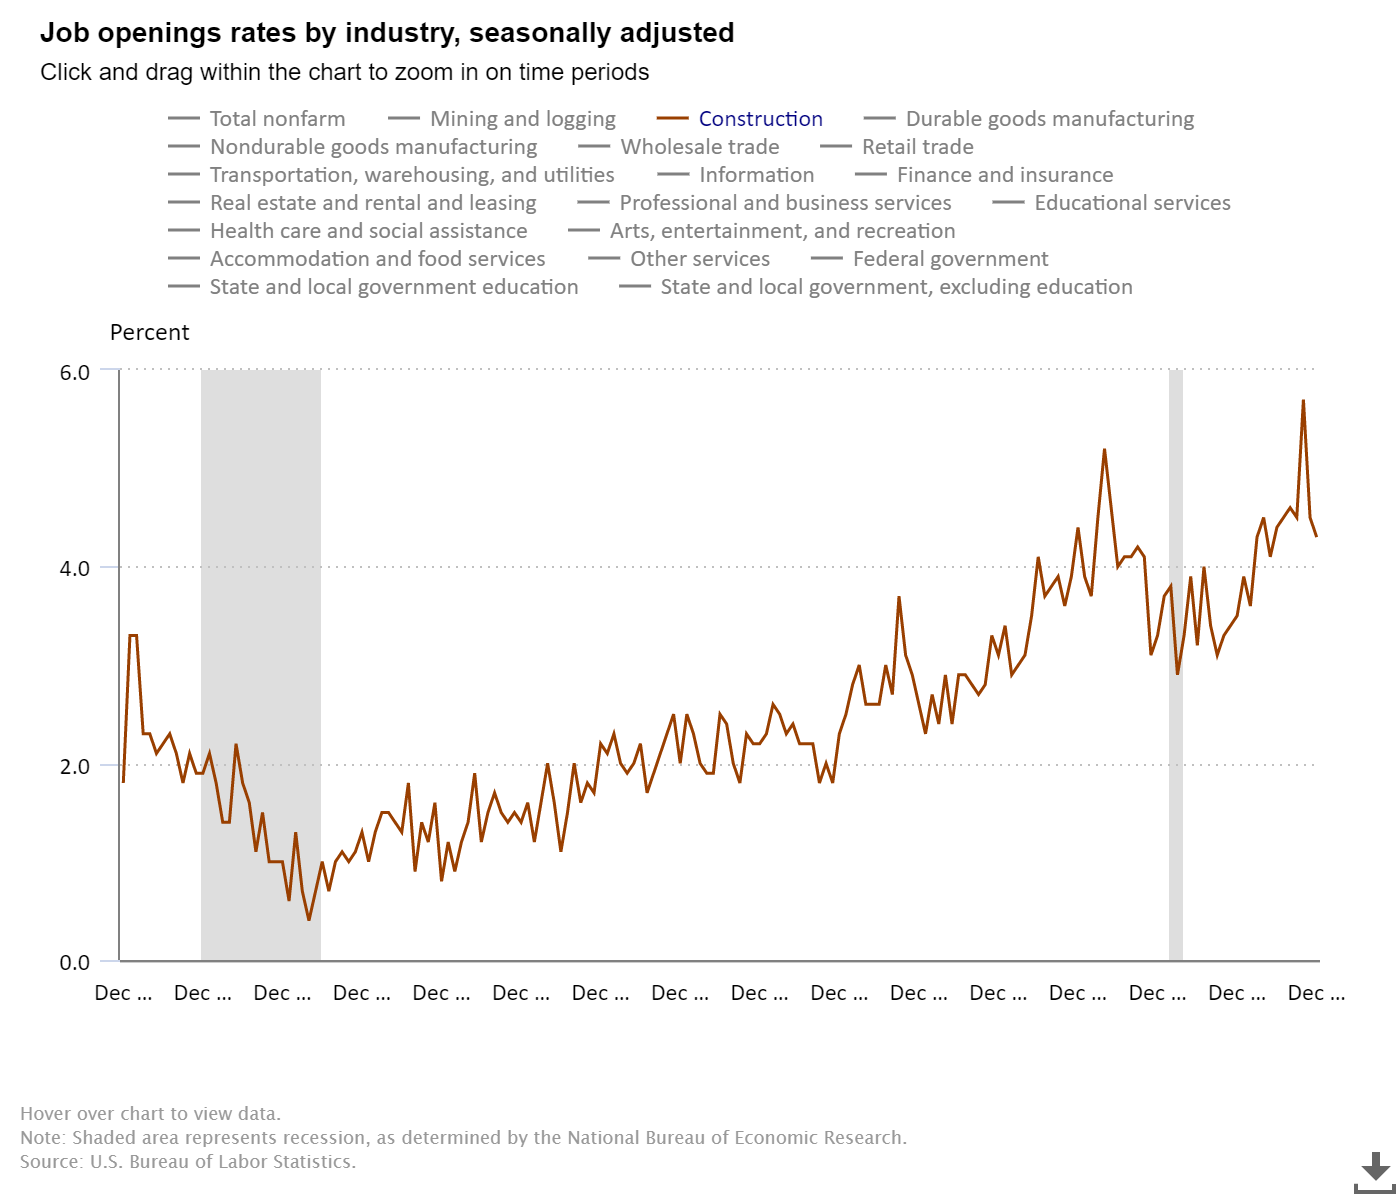
During this epic recovery, which started on April 7, 2020, I was very adamant on Twitter that job openings would hit 10 million soon. Today, job openings are now trending near 11 million. As you see from the chart below, the labor market dynamics from the end of the great financial crisis, where job openings were just a tad over 2 million, is much different today. People forget that we had near 7 million job openings before COVID-19 hit us. The trend was always your friend with this data line that many people often ignore.

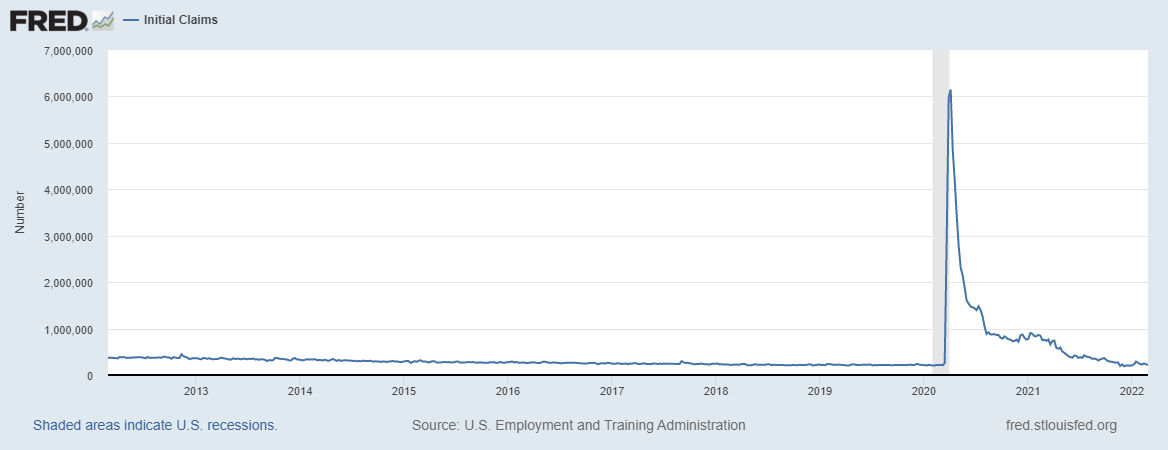
Jobless claims data looks solid. As the baby boomers retire, we need labor to replace them and grow jobs.
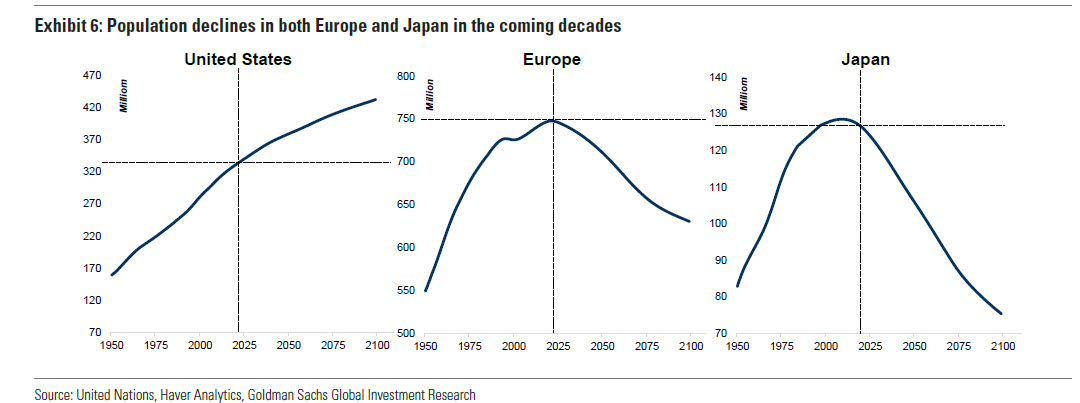
Luckily for the United States of America, our demographics are solid going out into this century compared to other countries. I have always stressed our American muscle is not just having king dollar but our demographics. This is why I use the term replacement buyers for housing, and it applies to workers too.
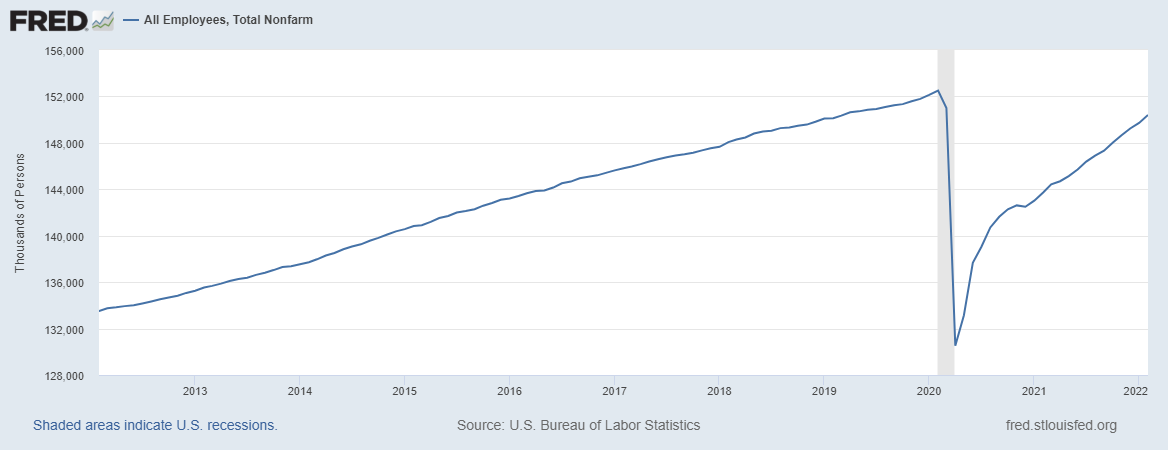
After I retired the America is back recovery model on Dec. 9, 2020, I knew the jobs recovery would lag all the other economic data for multiple reasons. However, we are getting closer to that September 2022 milestone. So, let’s look at the numbers today with seven months left until the September report:
—Feb 2020: 152,553,000 jobs
—Today: 150,390,000 jobs
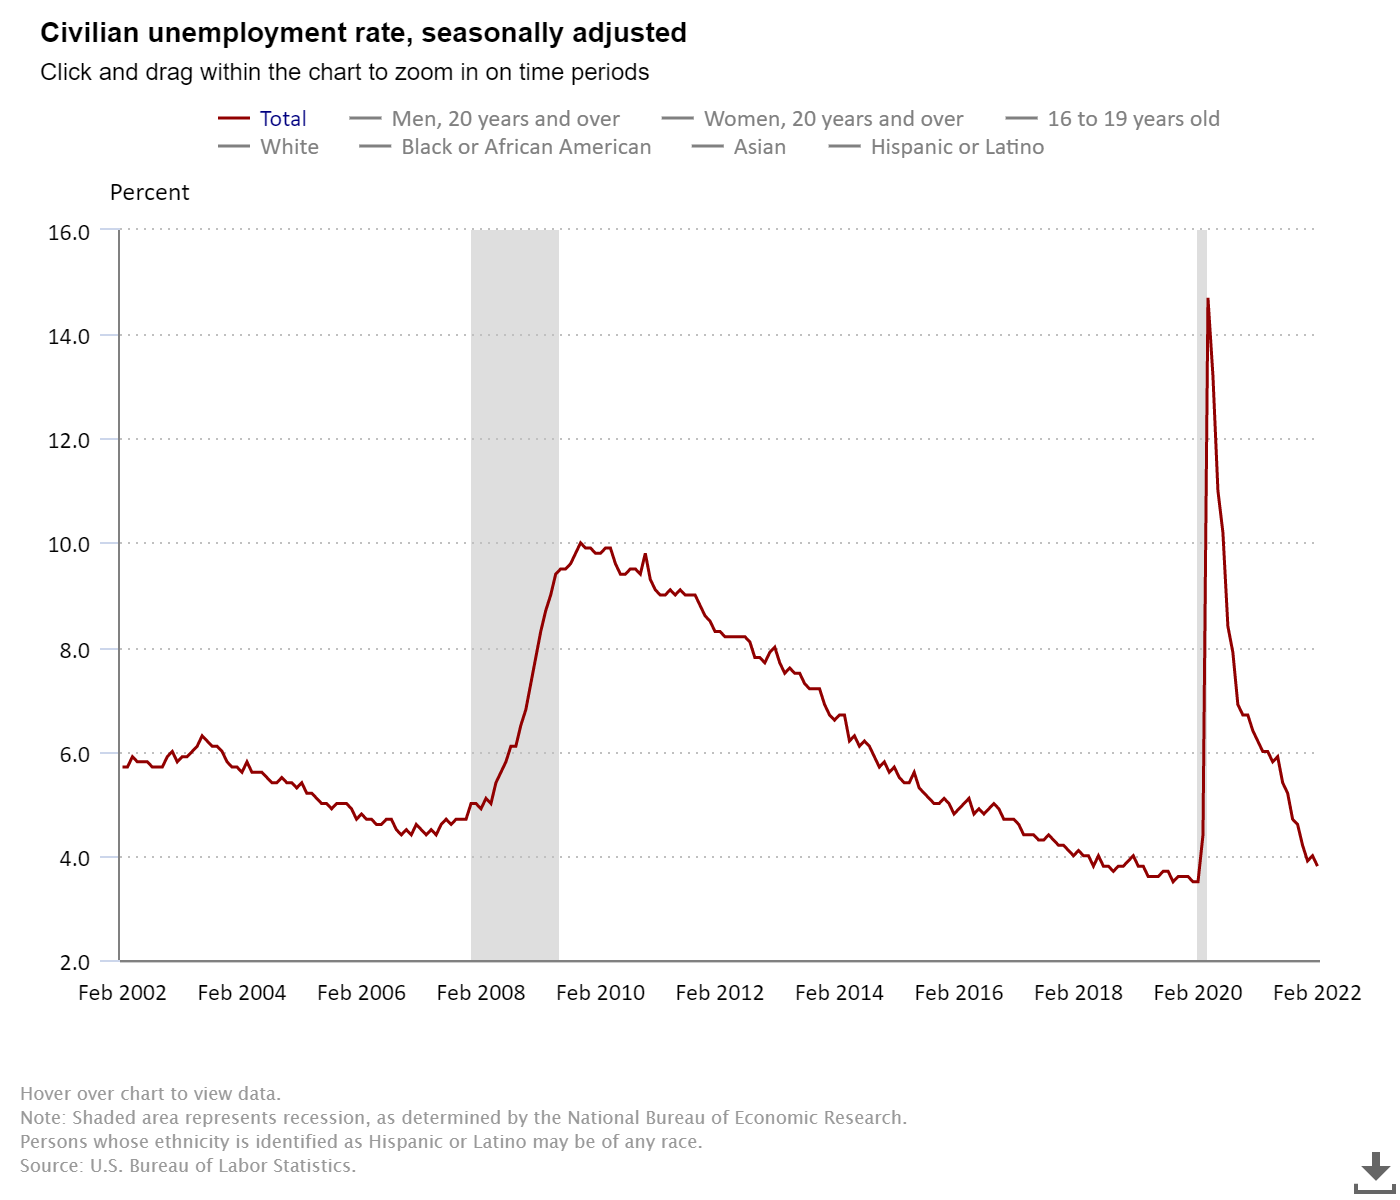
That leaves us with 2,163,000 jobs left to make up with seven months to go, which means we need to average adding 309,000 jobs per month. The unemployment rate currently stands at 3.8%.
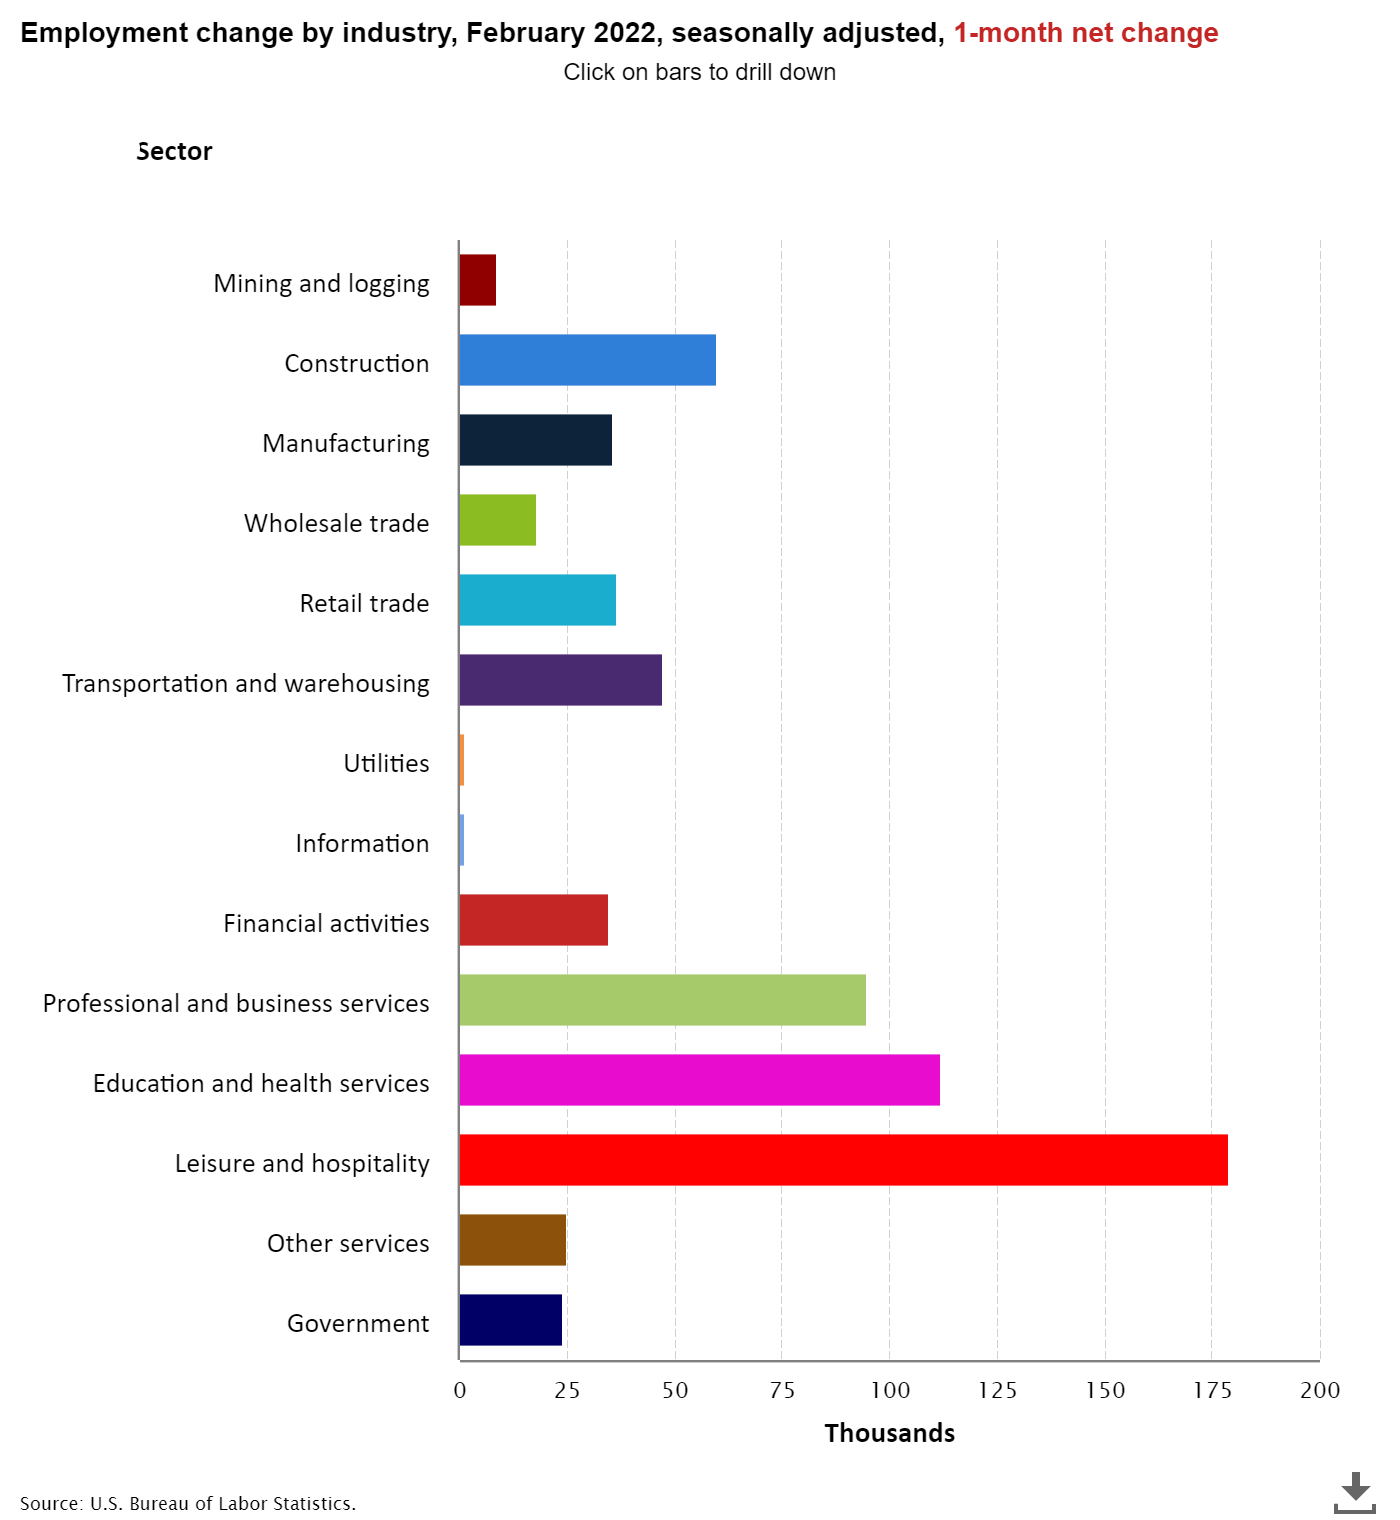
Take a look at the jobs data and which sector added jobs in February: Construction jobs came in big again, and we didn’t have any negative sectors the last month.
Job openings for construction workers are still historically high today as the need for labor in America is very high. So much for the premise that robots and immigrants would take all the jobs in America.
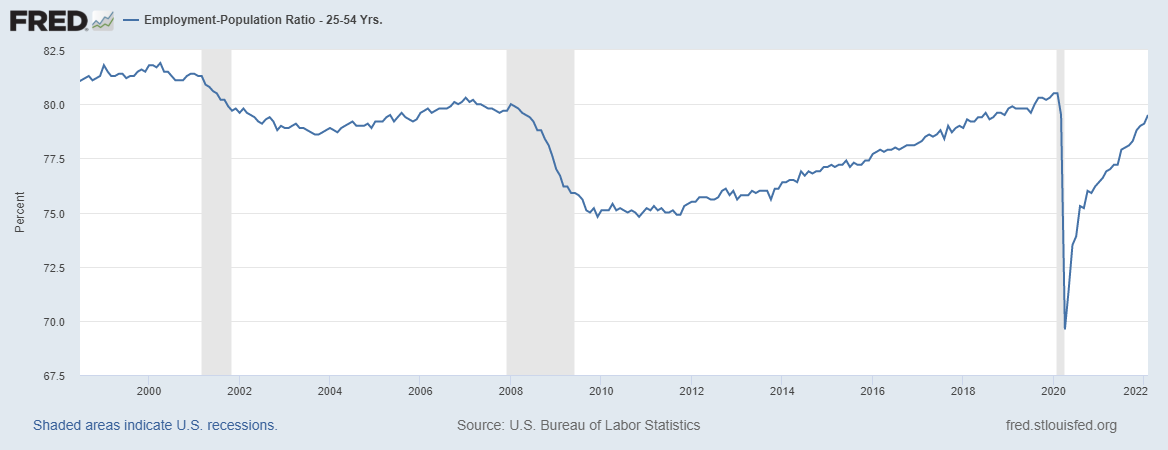
Looking at jobs data is always about prime-age employment data for ages 25-54. The employment-to-population percentage for the prime-age labor force is 1% away from being back to February 2020 levels. The jobs recovery in this new expansion has been much better than we saw during the recovery phase after the great financial crisis.
Education and employment
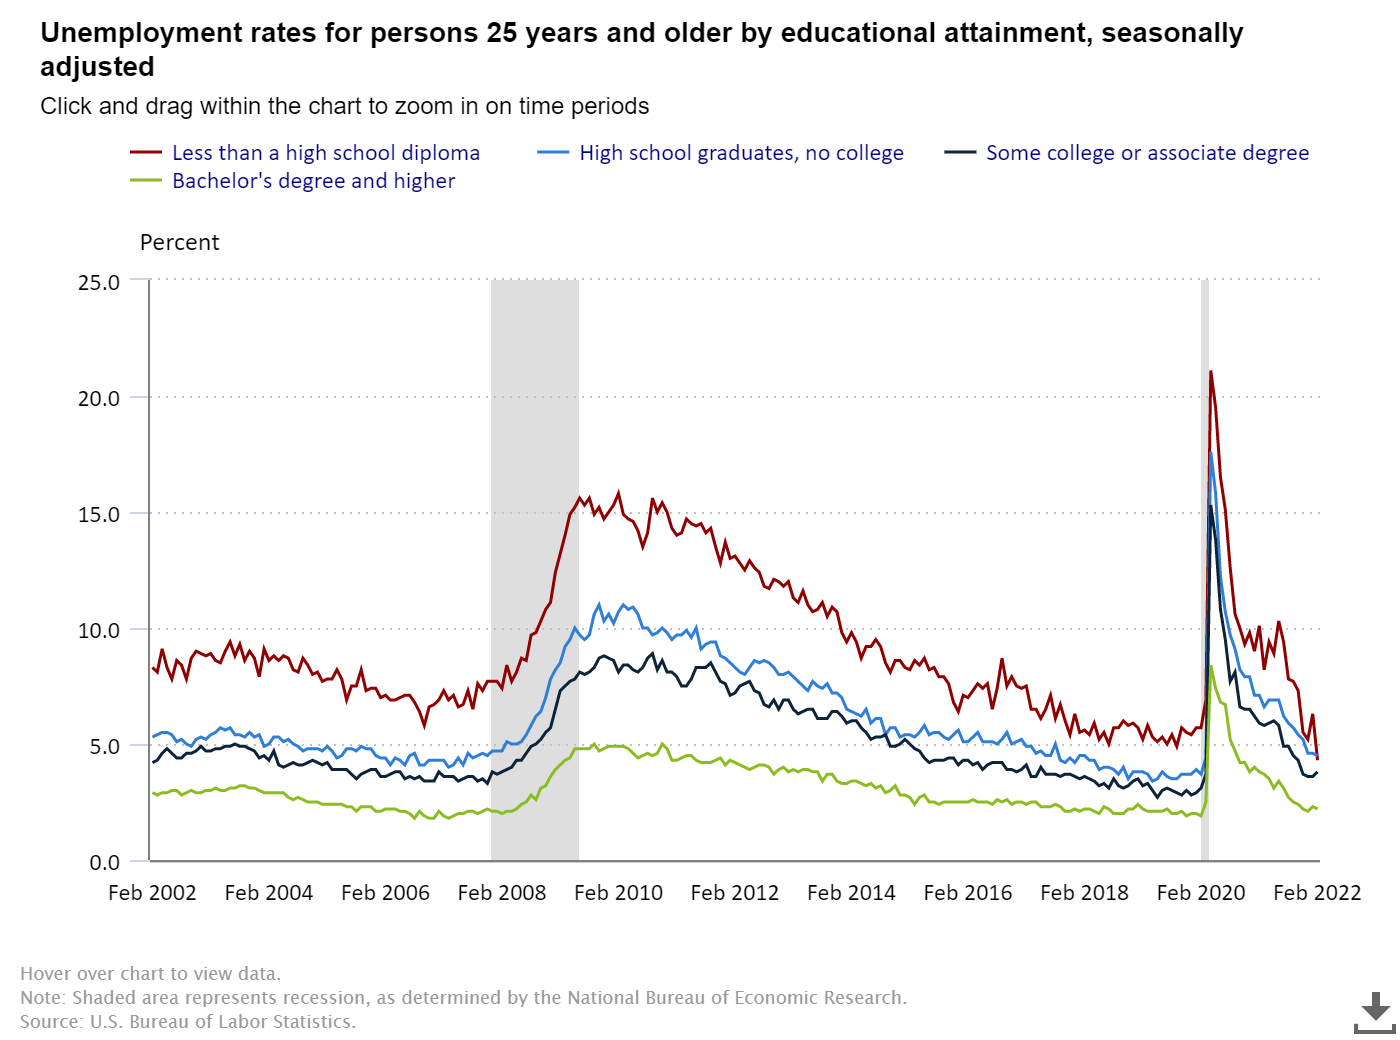
Most Americans have always been working, even if they’re not college-educated. The labor force with the least educational attainment tends to have a higher unemployment rate. I started the hashtag A Tighter Labor Market Is A Good Thing to remind everyone that the economy runs hot when we have a tighter labor market. We want to see the kind of unemployment rates that college-educated people have spread to everyone because we have tons of jobs that don’t need a college education.
Here is a breakdown of the unemployment rate and educational attainment for those 25 years and older:
—Less than a high school diploma: 4.3%.
—High school graduate and no college: 4.5%.
—Some college or associate degree: 3.8%
—Bachelor’s degree and higher: 2.2%.
The 10-year yield and mortgage rates
My 2022 forecast said: For 2022, my range for the 10-year yield is 0.62%-1.94%, similar to 2021. Accordingly, my upper end range in mortgage rates is 3.375%-3.625% and the lower end range is 2.375%-2.50%. This is very similar to what I have done in the past, paying my respects to the downtrend in bond yields since 1981.
We had a few times in the previous cycle where the 10-year yield was below 1.60% and above 3%. Regarding 4% plus mortgage rates, I can make a case for higher yields, but this would require the world economies functioning all together in a world with no pandemic. For this scenario, Japan and Germany yields need to rise, which would push our 10-year yield toward 2.42% and get mortgage rates over 4%. Current conditions don’t support this.
The 10-year yield has made a great attempt to break over 1.94% this year, as Germany and Japan’s bond yields rose noticeably in mid January. While our 10-year yield didn’t rise as much, once Japan and Germany broke out, our yields did get above 1.94% for the first time since 2019 for a few days. However, they haven’t been able to hold their increases.
As I am writing this, our 10-year yield is at 1.71%. I have stressed that it’s going to be very hard for the 10-year yield to break over 1.94% and have a higher duration, even with the hot economic growth with extremely hot inflation data. The trend in the 10-year yield, which has been going lower for decades, is simply too powerful. The 10-year yield didn’t collapse lower when we had deflationary pressures in 2009. Currently, the 10-year yield is not heading much higher as we see much higher year-over-year growth in inflation.
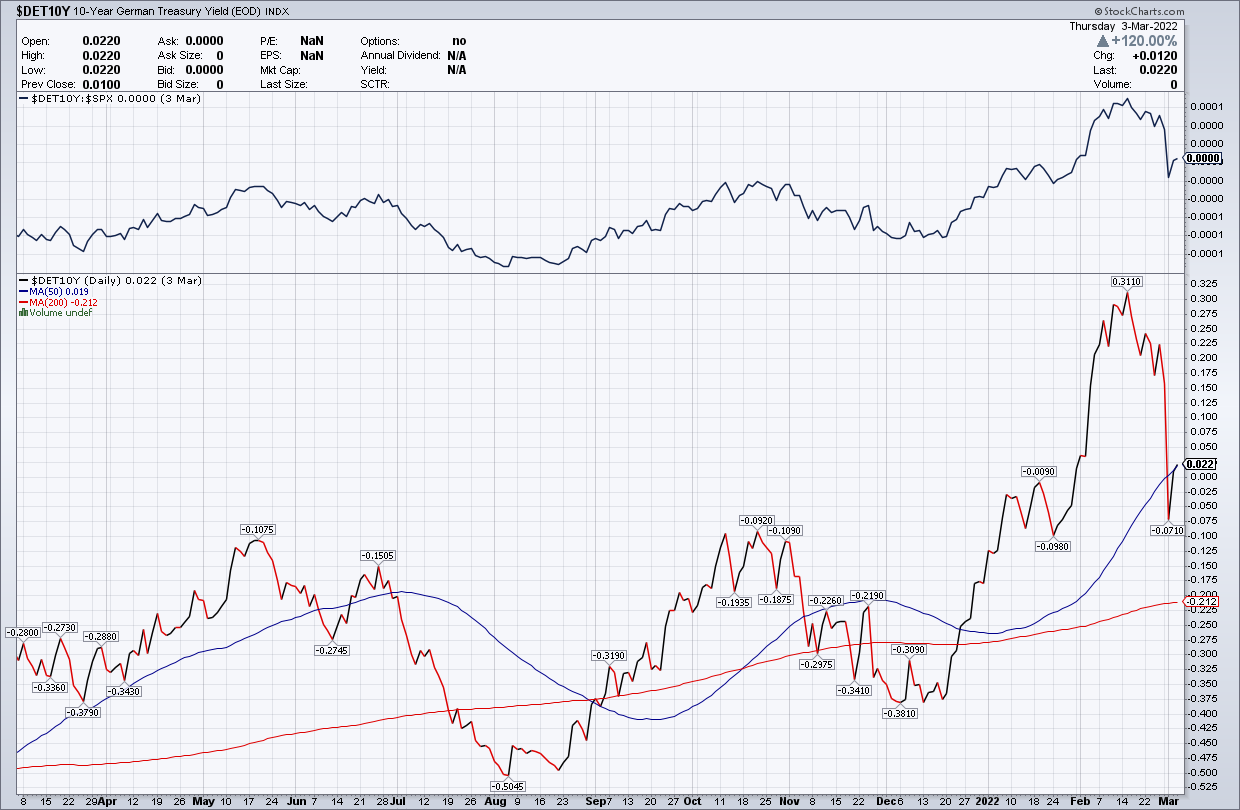
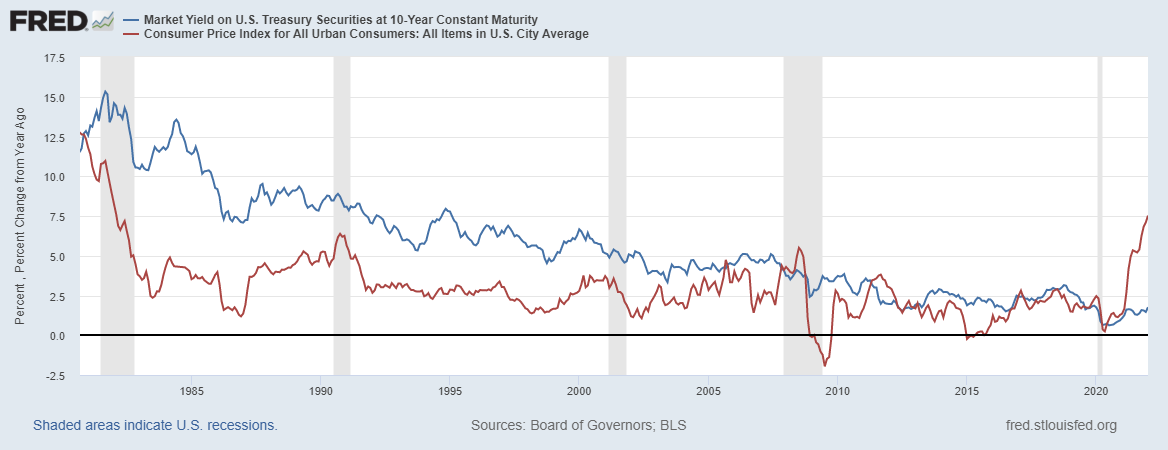
We have seen mortgage rates fall recently with the moves lower in the 10-year yield. If economic growth gets weaker toward the second half of 2022, it will be tough to have the 10-year yield getting above 1.94% and staying above that level. As you can see now, global yields need to rise for this to happen.
Economic cycle update
Now for an economic update. Some of the economic data has been cooling off as expected, but staying firm. We can’t replicate the same economic growth coming out of COVID-19. Eventually, we get back to our normal slow but steady economic growth patterns. Economics is demographics and productivity, and population growth is slowing here in the U.S., and productivity growth hasn’t been strong for a while now. We have limits to what we can do here in the U.S.
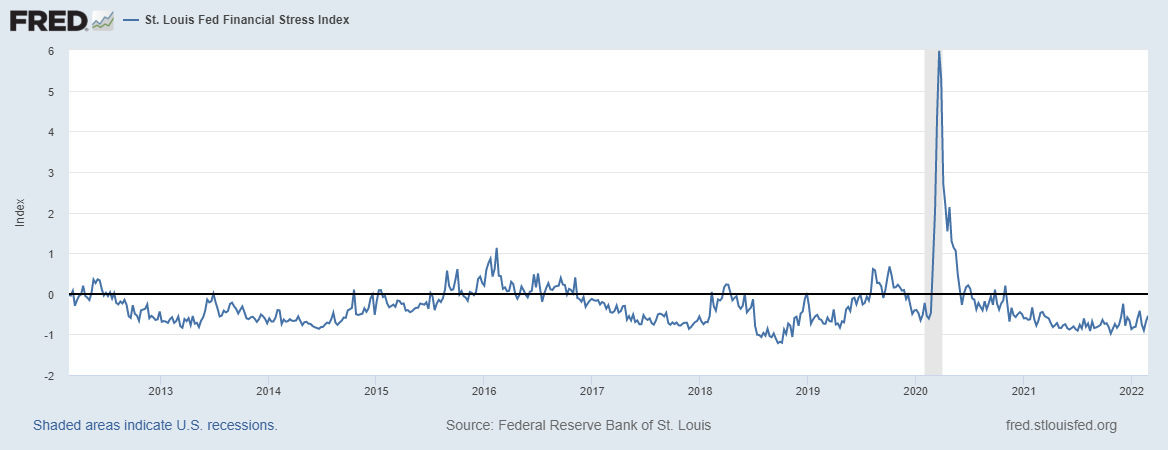
The St. Louis Financial Stress Index, a crucial variable in the AB recovery model, shows life lately at -0.5427%. The stock market has been more active lately, and the Russian Invasion has now put in a shock factor that has simply too many variables to account for. If things get better on that front, the markets will act better. However, we can see more stress in this index if things get worse. The oil and wheat shock in prices will impact global economies.
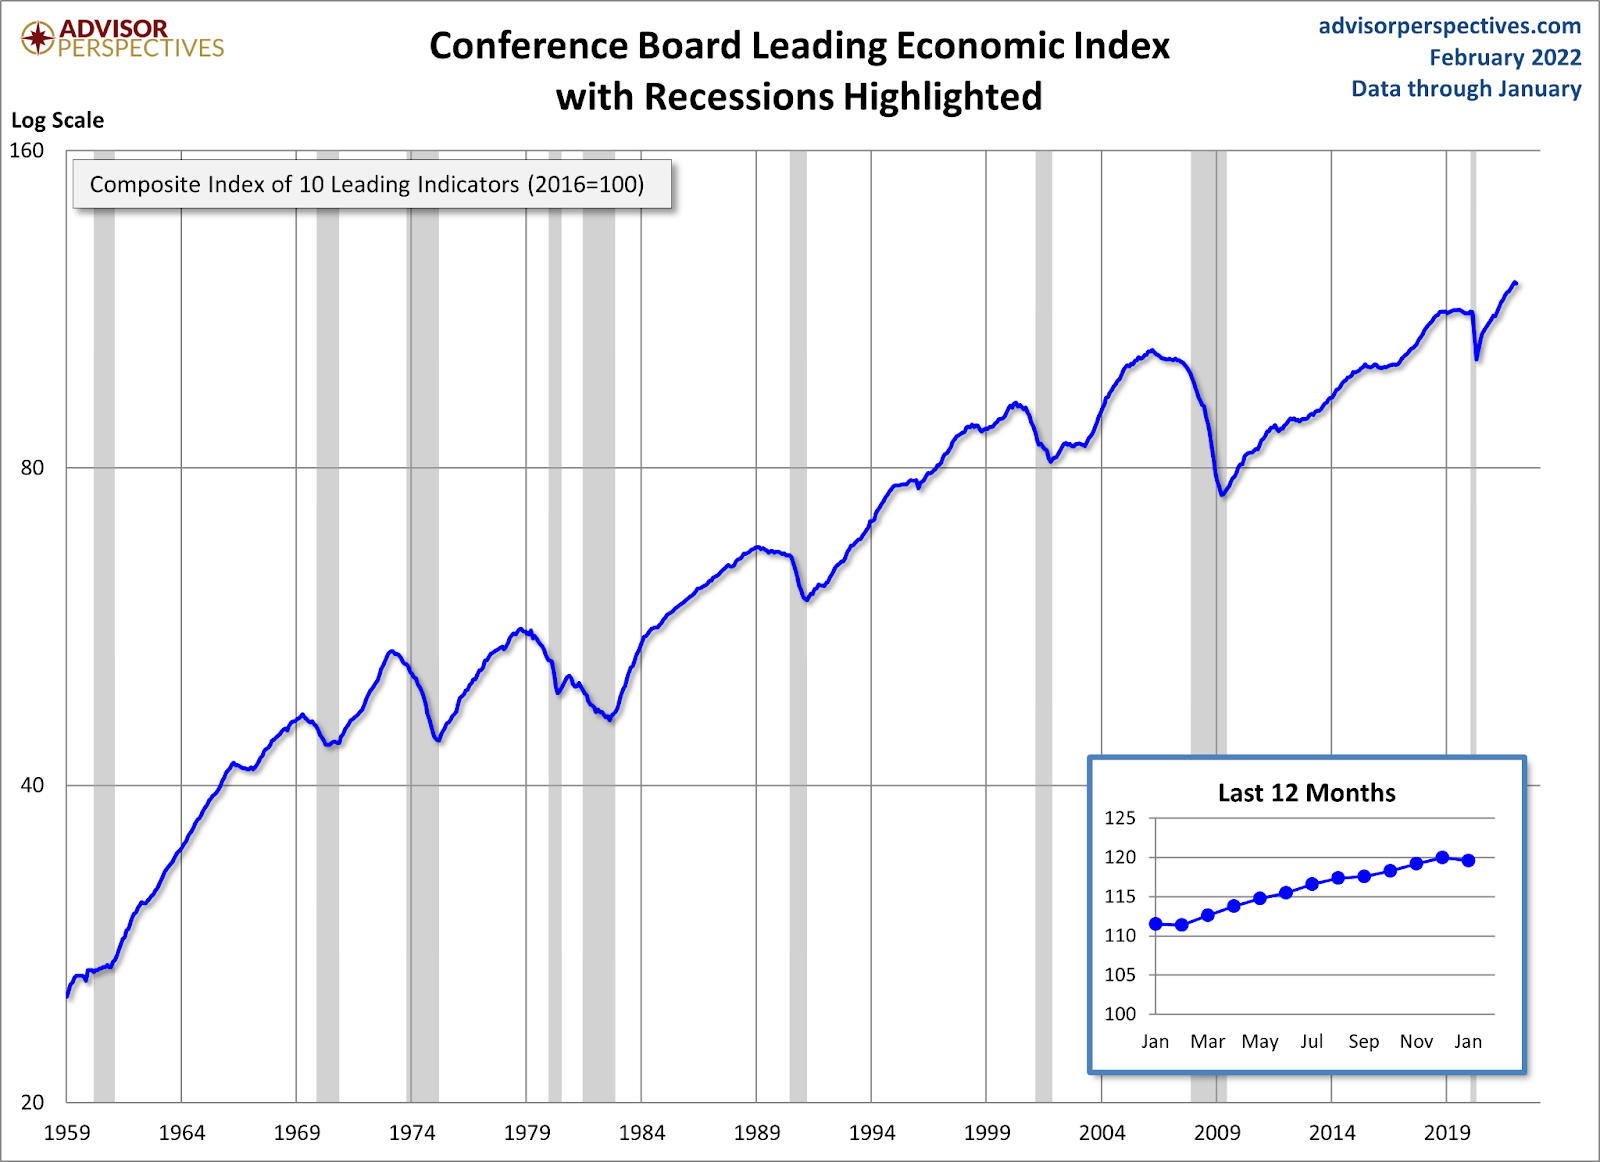
The leading economic index has had an epic recovery from the lows of April. However, last month it didn’t show any growth. When this data line falls four to six months, a recession red flag is raised. We aren’t there yet, but I am keeping an eye on this.
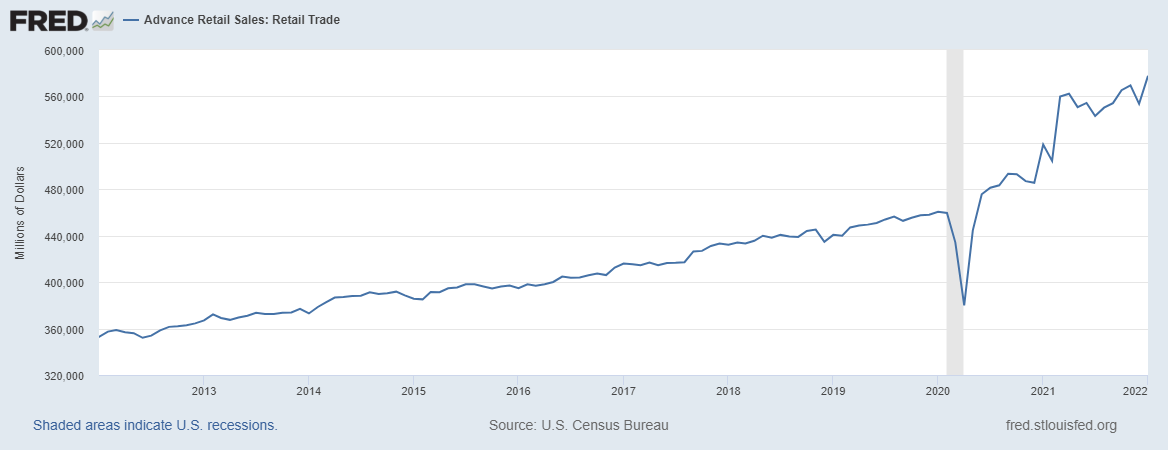
Retail sales have held up much better than I could have imagined; Americans are spending and even adjusting to inflation and retail sales are booming. However, the growth rate is getting back to normal after the crazy growth in 2021. The moderation in the data that I had expected is finally here but it has still been an impressive run for retail sales.
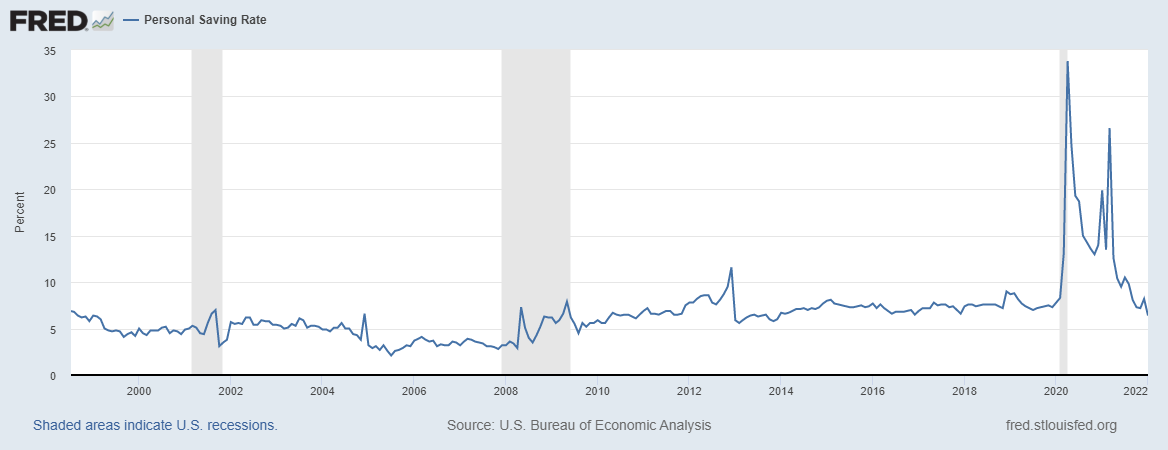
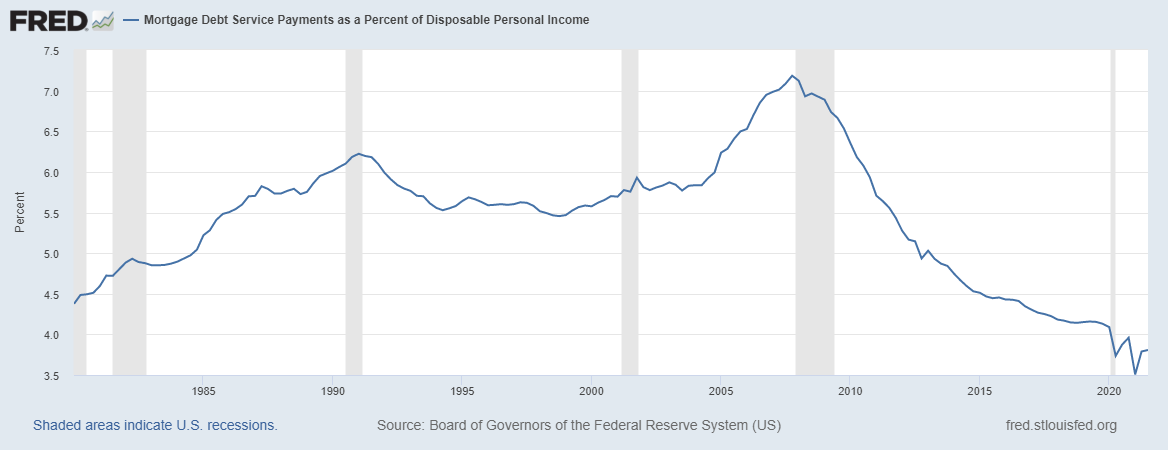
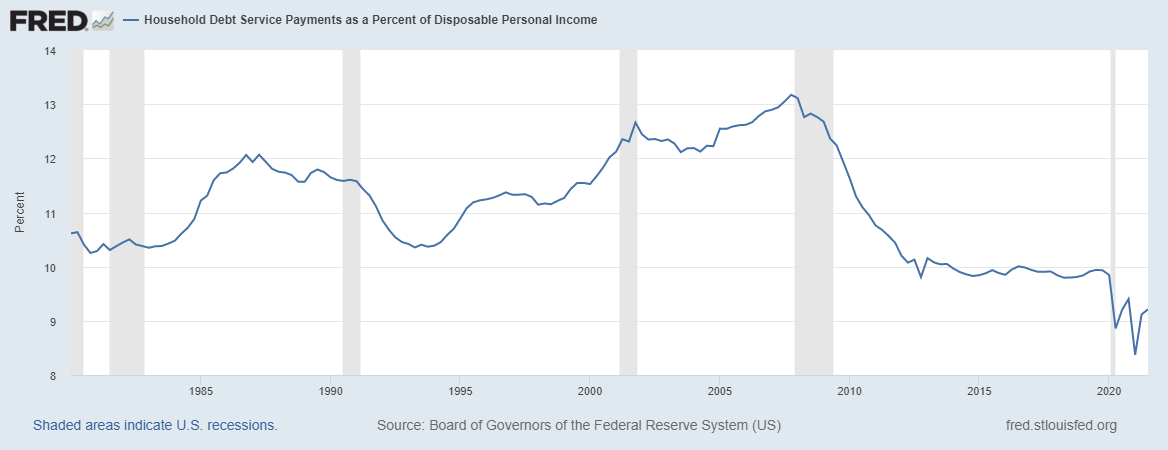
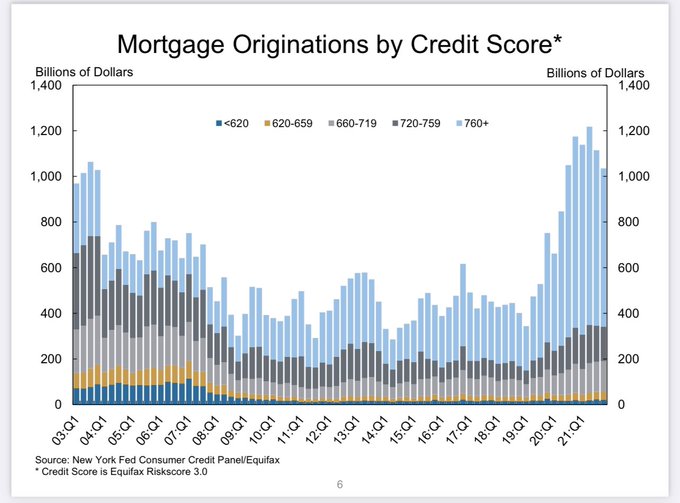
Americans’ personal savings rate and disposable income are healthy enough to keep the expansion going! Even though the disaster relief has faded from the economic discussion, both these levels are good to go as employment has picked up a lot from the COVID-19 lows with wage growth. We have to remember, households have more cash, more net wealth, and have refinanced their mortgages to have lower payments.
This is a big reason why households’ cash flow is much better now, and employment has been up a lot since the lows of COVID-19.
However, just like I had an America is Back recovery model on April 7, 2020, I have recession models and raise recession red flags as the expansion matures. I raised my first red flag recently when the unemployment rate got to 4%, and the 2-year yield got above 0.56%.
Once the Fed raises rates, the second recession red flag will be presented. This will most likely happen this month.
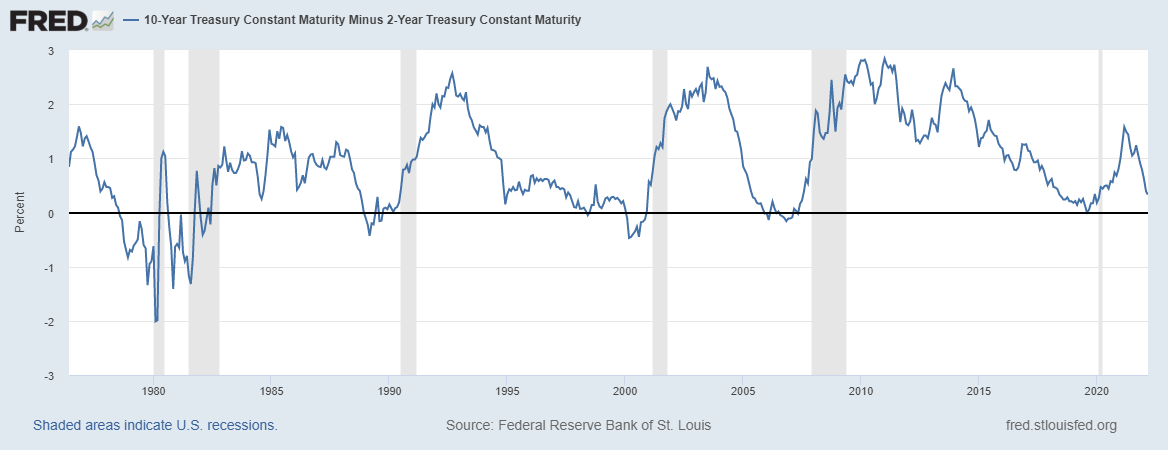
The third recession red flag is getting very close; the 2/10s are getting very close to inverting. I have been on an inverted yield curve watch since Thanksgiving 2021, and now it’s almost here. Typically we see an inverted curve before every recession. This red flag is very complicated, and once it is raised, I will go into more detail on how I look at this.
My job is to show you the progress of the economic expansion into the next recession and out — over and over again. Each economic expansion is unique, and with the Russian Invasion and massive price increases on oil and wheat, I have incorporated those factors into the equation. We have to take this one day at a time because the news can get better or worse with each passing day.


Always such a good read. Keep them coming.