As purchase mortgages shrank in the third quarter last year, the number of critical defect rates decreased, according to the Q3 2017 ARMCO Mortgage QC Industry Trends report from ACES Risk Management.
A critical defect is defined as a defect that would result in the loan being uninsurable or ineligible for sale. The critical defect rate reflects the percentage of loans reviewed for which at least one critical defect was identified during the post-closing quality control review and all reported defects are net defects.
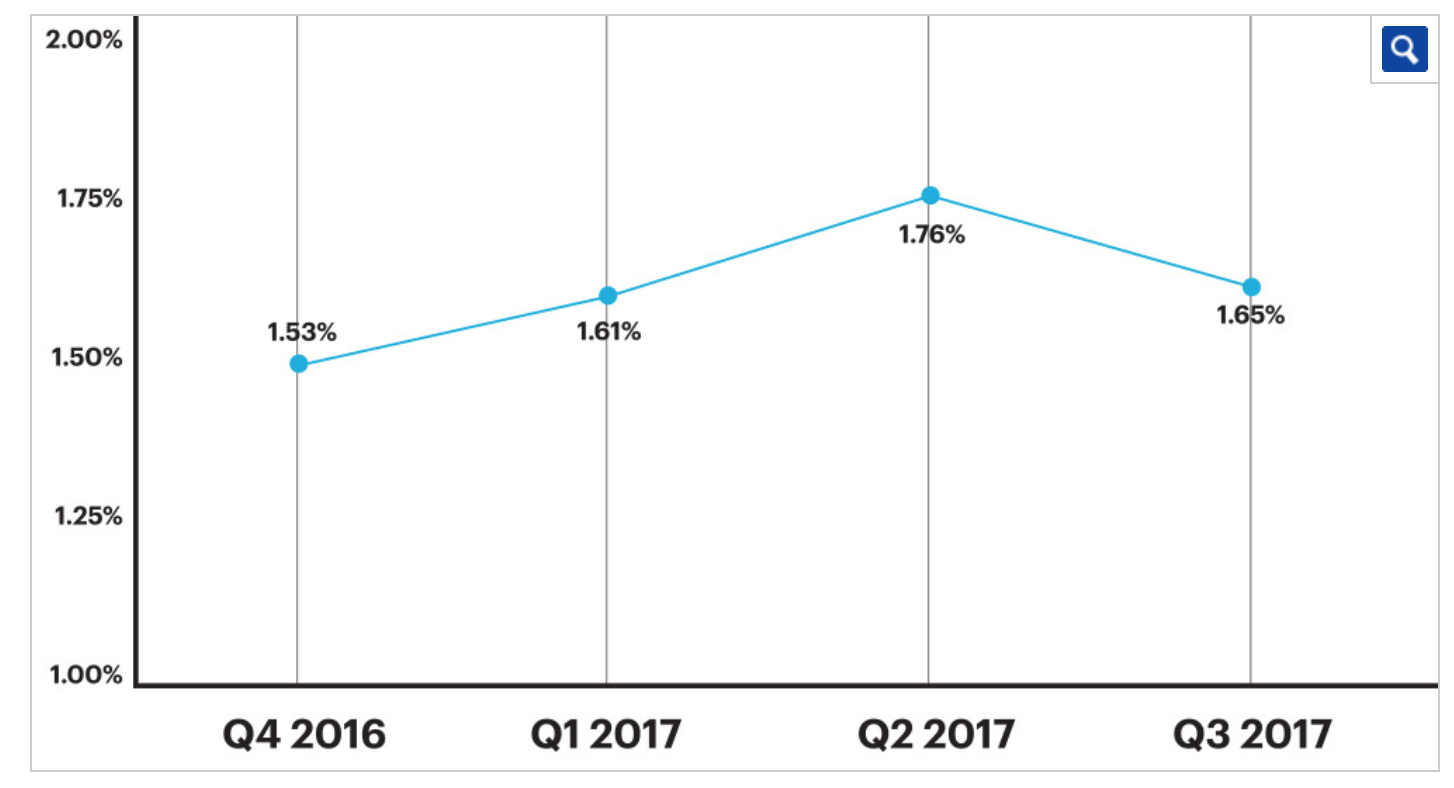
The critical defect rate decreased by 6% from 1.76% in the second quarter to 1.65% in the third quarter, as showed in the chart below. This represented the first decrease in the rate for 2017.
Click to Enlarge
(Source: ARMCO)
ARMCO’s report showed this decrease in the critical defect rate is due to a decline in purchase loans, which have a disproportionately higher number of defects, and an increase in mortgage refinances.
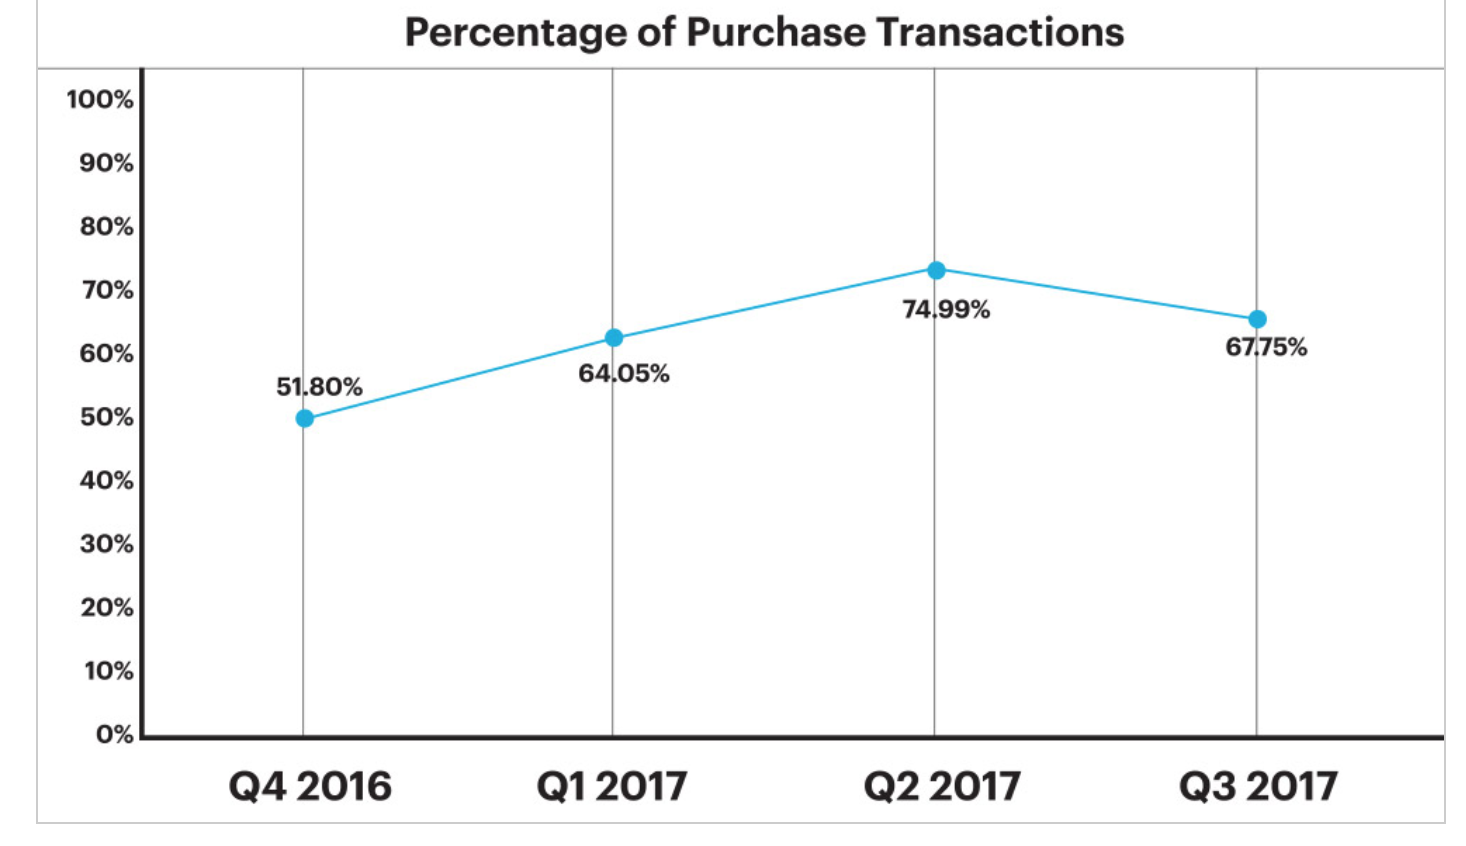
In the third quarter, purchase transactions accounted for more than 67% of all reviewed loans, but more than 72% of all reported critical defects. This imbalance, the ratio of critical defects in purchase transactions versus the ratio of purchase transactions as a percentage of the benchmark, indicates that critical defects were attributed more to purchases than to refinances in the third quarter, according to the report. The greater complexity associated with purchase transactions could be associated with a greater number of critical defects.
“As the percentage of refis increased in the third quarter of 2017, we saw a drop in critical defect rates,” ARMCO President Phil McCall said. “That said, purchases still comprise the majority of mortgages originated, so critical defect activity still aligns with what you’d see in a purchase-driven market.”
“Lenders need to be mindful of the risks inherent with purchase transactions and take precautions, regardless of fluctuations in purchase/refi market share,” McCall said.
The chart below showed that while the share of purchase mortgages had been increasing each quarter, the share slipped in the third quarter.
Click to Enlarge
(Source: ARMCO)
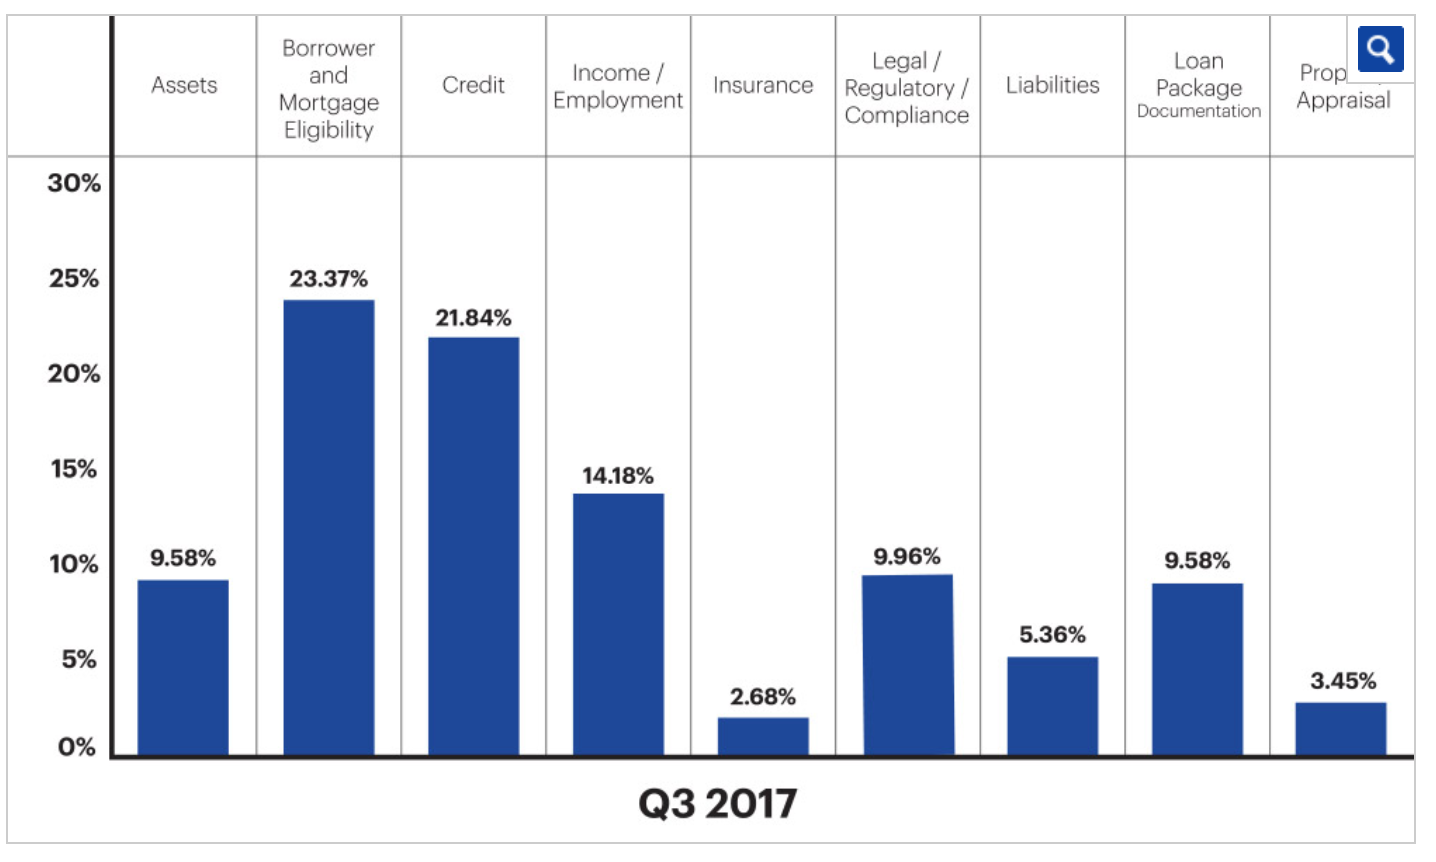
The Fannie Mae categories borrower and mortgage eligibility, credit and income/employment made up nearly 60% of all defects reported in the third quarter. Borrower and mortgage eligibility accounted for about 23% of all reported critical defects, followed by credit with 22% and employment/income with 14%.
Click to Enlarge
(Source: ARMCO)
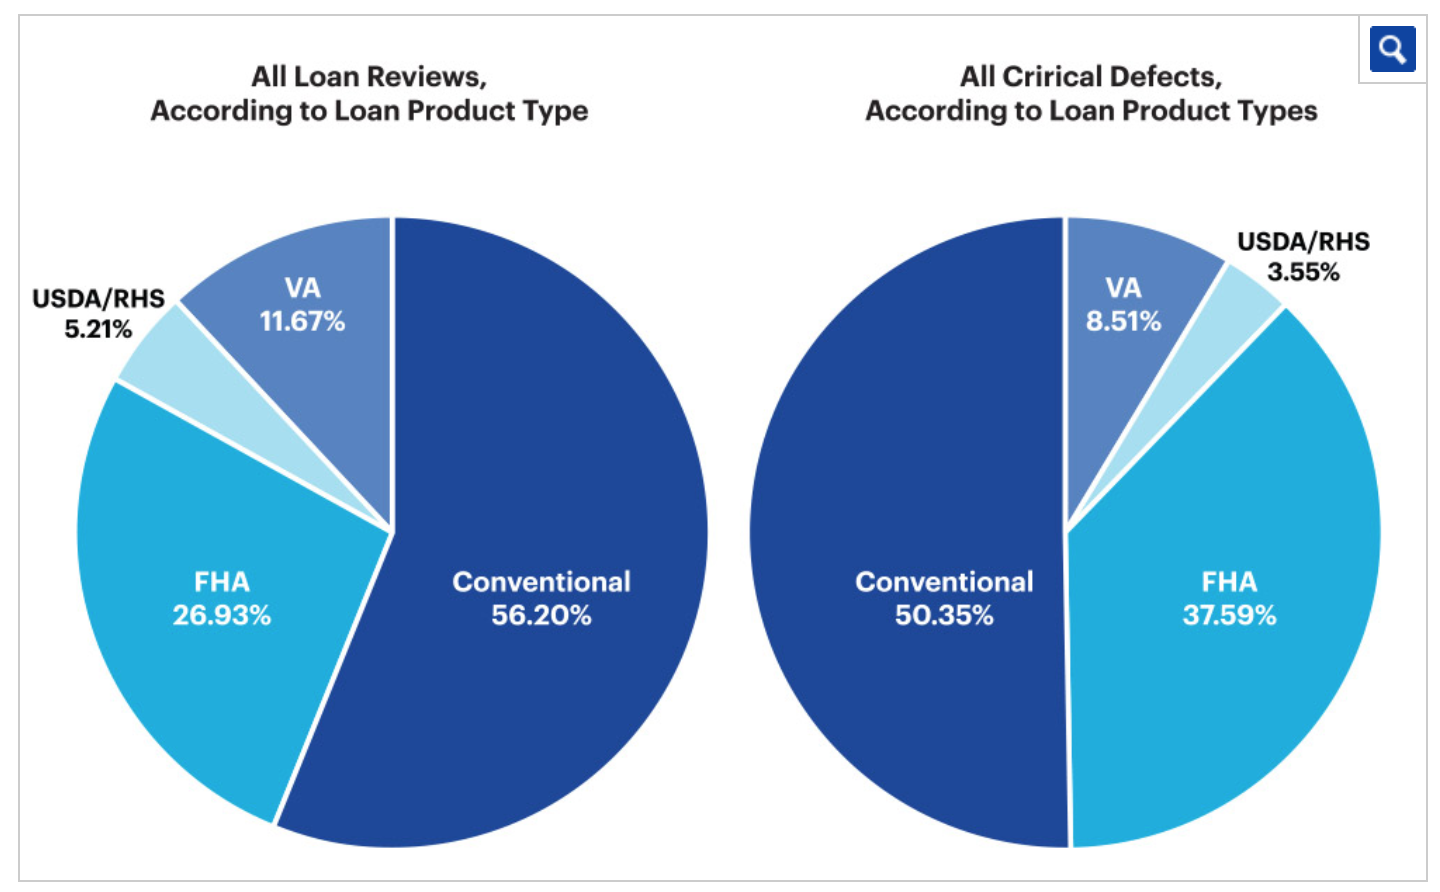
Conventional loans were the most utilized mortgage in the third quarter, accounting for 56.2% of all mortgages reviewed. This was followed by FHA loans at 26.9%, VA loans with 11.7% and USDA loans with 5.2%.
But, as the charts below show, the defects were not proportionate with the share of each mortgage type. Notably, FHA loans accounted for about 27% of all loan types, but made up more than 37% of all loans containing critical defects.
Click to Enlarge
(Source: ARMCO)


