Home prices continued to increase in May, however experts explained housing is not repeating the bubble period, according to the latest report from S&P Dow Jones Indices and CoreLogic.
The S&P CoreLogic Case-Shiller U.S. National Home Price Index, which covers all nine U.S. census divisions, increased 5.6% in May, the same increase as the month before. Before seasonal adjustment, the National Index increased 1% from May, however after seasonal adjustment, it increased just 0.2%.
“Home prices continue to climb and outpace both inflation and wages,” said David Blitzer, S&P Dow Jones Indices managing director and chairman of the index committee. “Housing is not repeating the bubble period of 2000 to 2006: price increases vary across the country unlike the earlier period when rising prices were almost universal; the number of homes sold annually is 20% less today than in the earlier period and the months’ supply is declining, not surging.”
“The small supply of homes for sale, at only about four months’ worth, is one cause of rising prices,” Blitzer said. “New home construction, higher than during the recession but still low, is another factor in rising prices.”
Other experts agree the rising home prices do not point to a bubble.
“Now, the one complicating factor is the mortgage interest deduction, which makes housing in the 80s look less affordable than it really was,” said Brent Nyitray, iServe Residential Lending director of capital markets. “Taxes were higher, and interest as a percentage of the P&I payment was higher, so the differences are somewhat exaggerated.”
“However, it does appear that buying a house is not as ‘unaffordable’ as the median house price to median income ratio implies,” Nyitray said. “Just remember these graphs when you hear people discussing how high real estate prices are and that we are in another bubble. We aren't.”
The 10-City Composite also increased, rising 4.9% from last year. This increase is down from the 5% annual increase in April. Before seasonal adjustment, the 10-City Composite increased 0.7%, however after seasonal adjustment it showed no increase.
Similarly, the 20-City Composite increased 5.7% in May from last year, down from April’s annual increase of 5.8%. It increased 0.8% before seasonal adjustment, but only 0.1% after the adjustment. All top 20 cities in the U.S. reported increases before seasonal adjustment, and after seasonal adjustment 14 cities saw monthly price increases in May.
The chart below shows the National, 10-City and 20-City Indices, and their history. As of May 2017, the average home prices within the 10-City and 20-City Composites hit 2007 levels in home prices.
Click to Enlarge
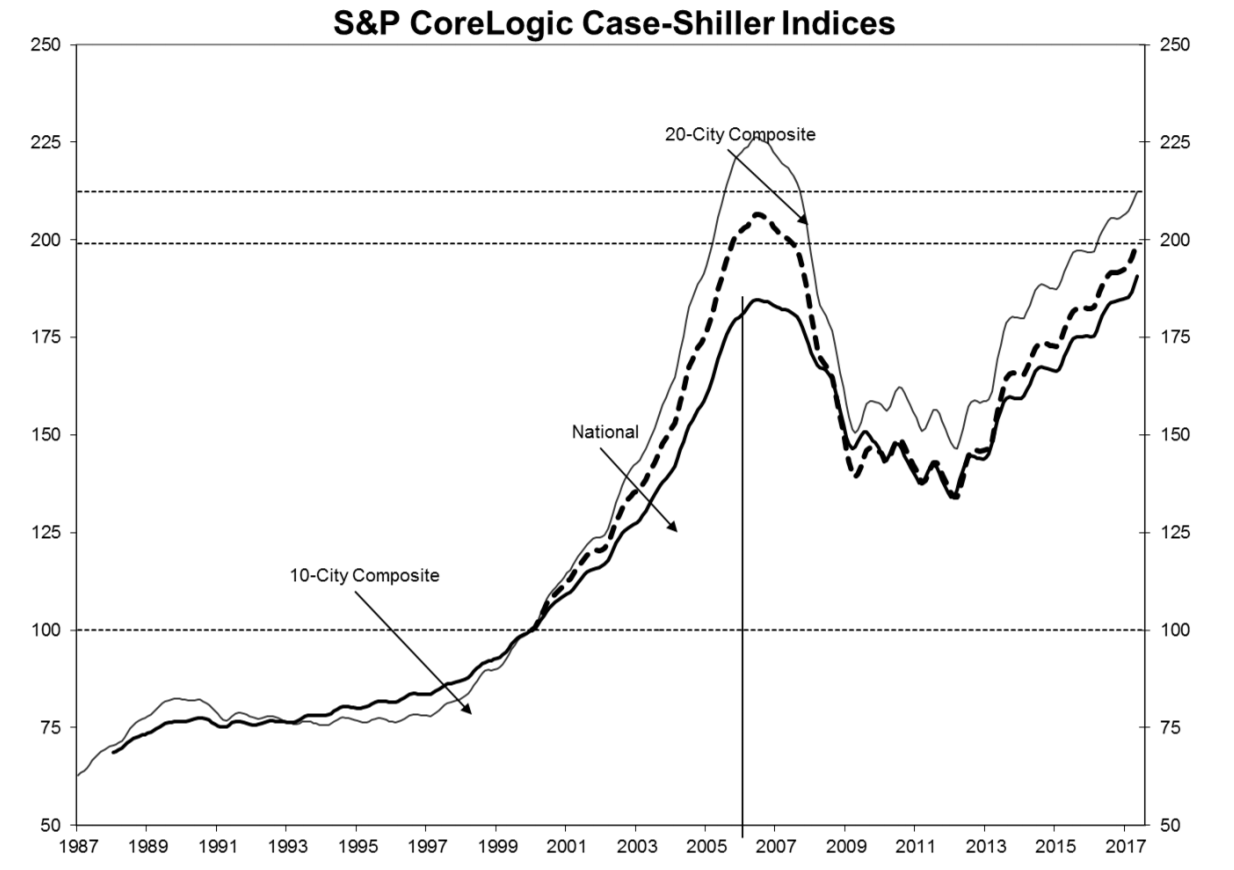
(Source: S&P Dow Jones)
“For the last 19 months, either Seattle or Portland was the city with fastest rising home prices based on 12-month gains,” Blitzer said. “Since the national index bottomed in February 2012, San Francisco has the largest gain. Using Census Bureau data for 2011 to 2015, it is possible to compare these three cities to national averages.”
“The proportion of owner-occupied homes is lower than the national average in all three cities with San Francisco being the lowest at 36%, Seattle at 46%, and Portland at 52%,” he said. “Nationally, the figure is 64%. The key factor for the rise in home prices is population growth from 2010 to 2016: the national increase is 4.7%, but for these cities, it is 8.2% in San Francisco, 9.6% in Portland and 15.7% in Seattle. A larger population combined with more people working leads to higher home prices.”