

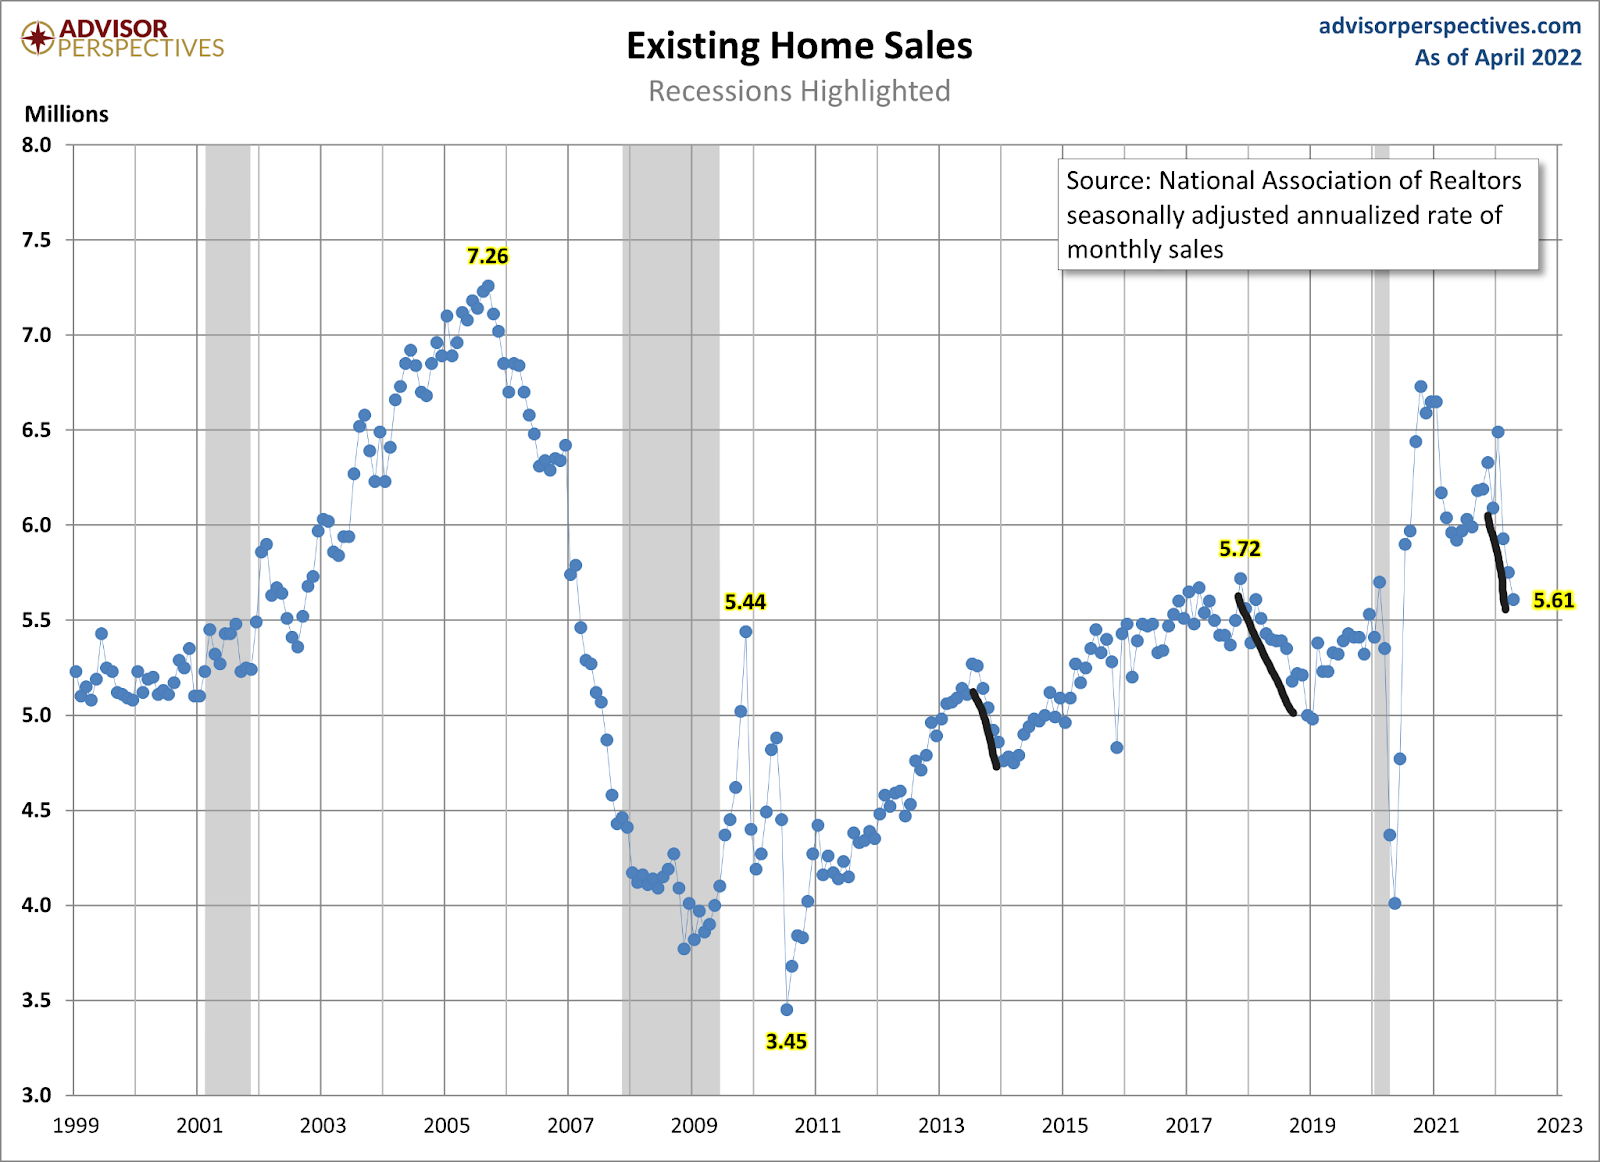
The National Association of Realtors reported Thursday that existing home sales for April came in at 5.61 million, with double-digit home-price growth driving a housing market that is still savagely unhealthy.
However, this year has seen one big game-changer: the 10-year yield finally cracked over 1.94%, which drove mortgage rates over 4%. This is something that I said would change the tone of housing, and we are seeing that result this year as sales decline and inventory picks up.
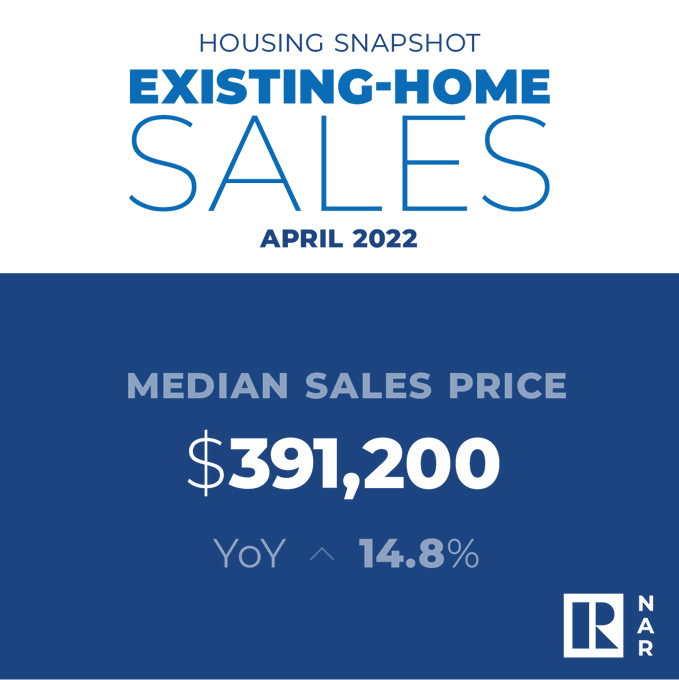
The real story in housing has been the price boom that we have seen since 2020. I was adamant about the price growth rule of 23% from 2020 to 2024. As long as prices only grew by 23% during these five years, we would be OK. Of course, that didn’t happen, in fact, median home price growth today was 14.8%.
From NAR Research: In April, the median existing-home price for all housing types was $391,200, up 14.8% from April 2021 ($340,700), as prices increased in each region. This marks 122 consecutive months of year-over-year increases, the longest-running streak.
Wait, what? How are home prices up 14.8% year over year? We were told that population growth is slowing, we were told that Americans would panic sell and that massive inventory would hit the marketplace once rates got to 4%. Spoiler: If you haven’t realized that the housing market since 2012 has been trolled out by professional grifters who don’t ever forecast sales, that is on you. Economics done right should be boring, and you always want to be the detective, not the troll. It’s May 19, mortgage rates are over 5.5%, and the mass exodus of 7-8 million Americans selling their homes to cash out at any price has never happened.
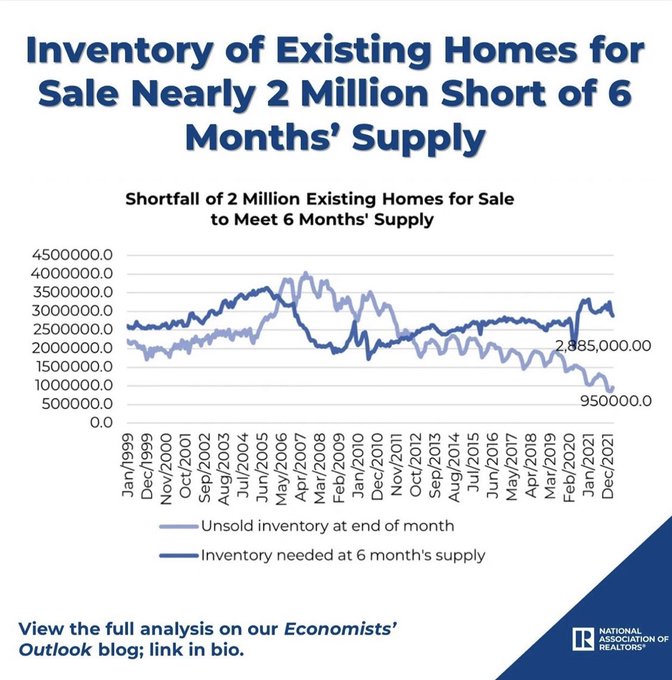
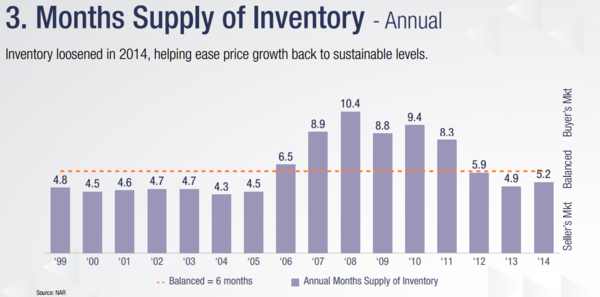
Inventory is always seasonal. It rises in the spring and summer and fades in the fall and winter. My rule to get the housing market out of the unhealthy stage is that we need total inventory back between 1.52 million and 1.93 million. Today inventory levels are at 1.03 million.
I use the 1.52-1.93 million range because it brings us back to 2018-2019 levels, the last time we had a balanced housing market. The last time we had total inventory growth was back in 2014 when we tried to get back to 2.5 million units and six months of supply; we couldn’t do that then, even though purchase application data was down on trend 20% year over year.
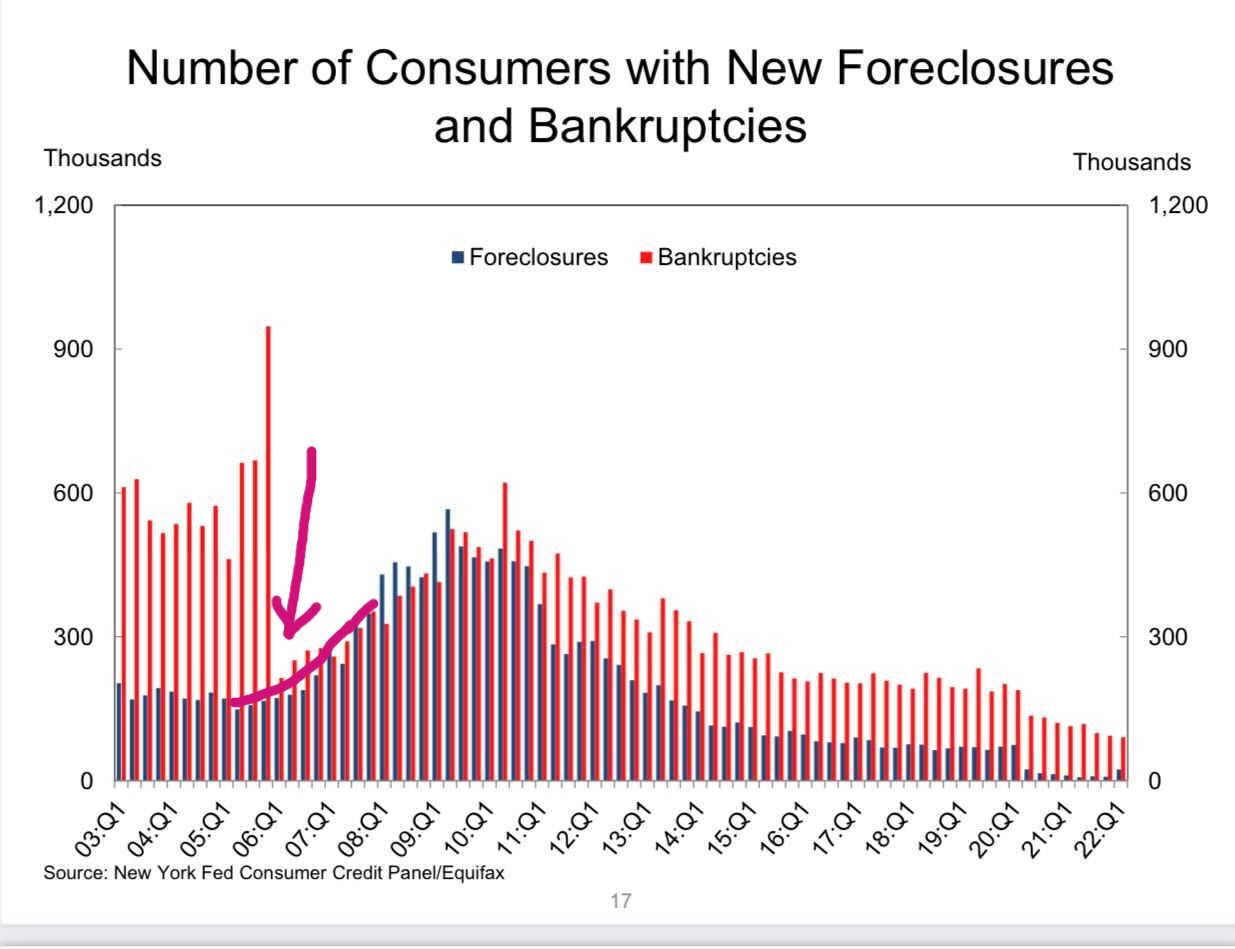
Because we had a housing credit bubble from 2002 to 2005, the credit demand push on exotic loan debt structures was a setup for future forced credit selling. What I mean by forced credit selling is that the homeowner’s credit financials didn’t allow them to have the capacity to own the home any longer, so they were forced to sell their home. This created an abnormal amount of foreclosures and short sales, which exploded the supply levels for the existing home sales market. As we can see below clearly, the market worsened before the job-loss recession happened.
This was a big reason why we saw the monthly supply data pick up in 2006, 2007 and 2008 — all before the job-loss recession happened late in 2008. The job-loss recession added more forced credit selling into the mix.
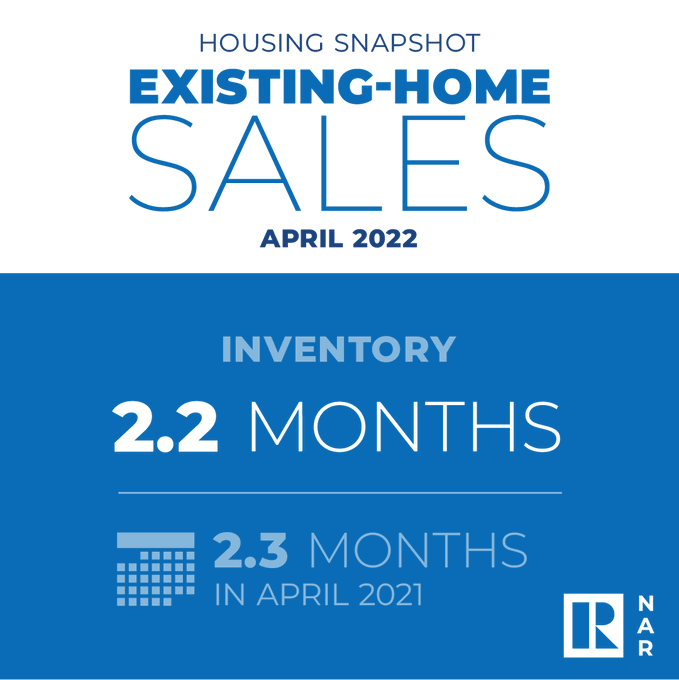
We have been through a lot of drama since 2012, especially the drama in 2020, 2021 and 2022. We are sitting with just 2.2 months of supply. Now supply should pick up with higher rates — we had our first weekly positive print. We are not taking the unhealthy housing market theme off this marketplace.
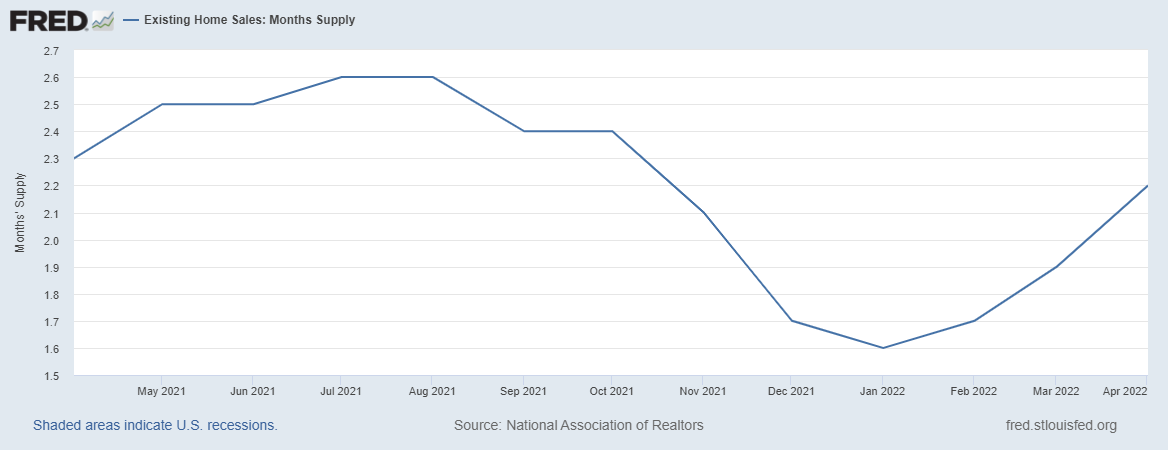
NAR Research: At the end of April, the total housing inventory amounted to 1,030,000 units, up 10.8% from March and 10.4% from one year ago (1.15 million). Unsold inventory sits at a 2.2-month supply at the current sales pace.
In February of 2021, when I was saying that we need higher rates to cool housing, my mindset was that there were two things higher rates could do: They could cool down price growth and create more days on the market. More days on the market is the number on the short-term data line that I want to rise to above 30 days. Currently, it’s at 17 days; anything that is a teenager with this data line is exceptionally unhealthy.
NAR Research: First-time buyers were responsible for 28% of sales in April; Individual investors purchased 17% of homes; All-cash sales accounted for 26% of transactions; Distressed sales represented less than 1% of sales; Properties typically remained on the market for 17 days.
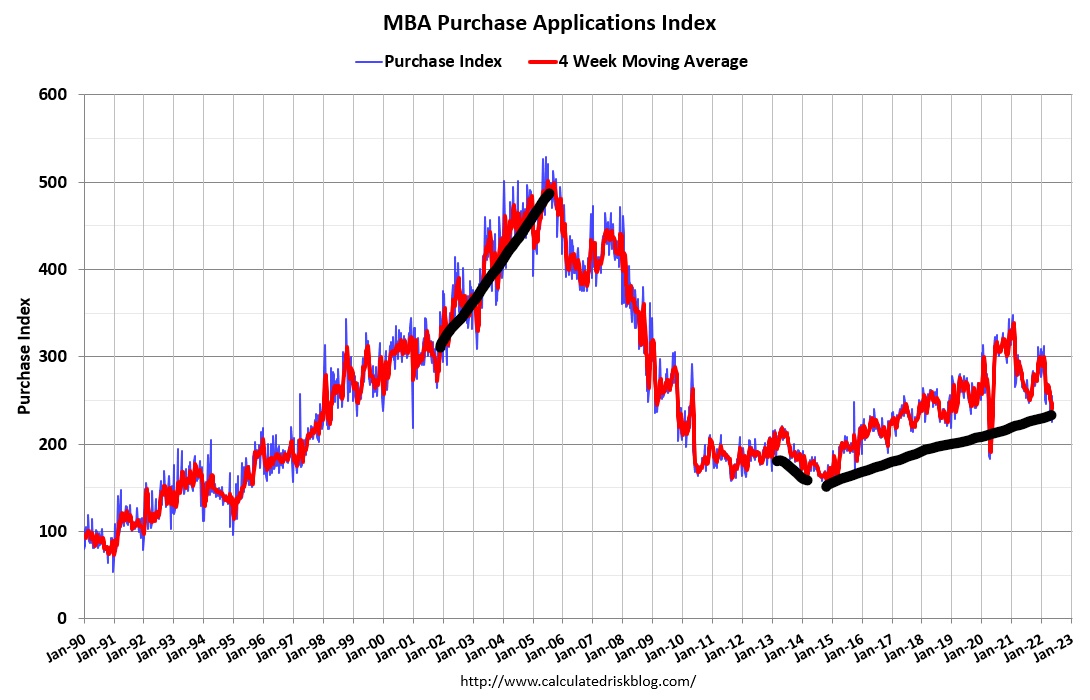
Currently, the housing market is reacting just like you would expect when we have higher rates. When have seen higher rates cool down sales before, and right now, it seems the same to me. I kept that target level of 1.94% going on during 2020-2022 as an inflection point for housing. This is sticking with my theme in the past that when rates rise, it cools down housing. Even though mortgage rates are historically low, they still always matter because mortgage buyers are the biggest homebuyers in America. We still have some legs to move lower in sales. Hopefully, this chart gives you some context to previous times when rates have risen post-2010.
The one aspect of higher rates that I have gotten wrong so far is that I was anticipating a bigger hit to mortgage demand by now. Because the home-price growth level broke my model, higher rates at this stage mean a bit more to me than most. So, I was anticipating purchase application data to be down 18%-22% year over year by now. That level would be a traditional decline with a noticeable hit from demand working from a higher base than in the previous expansion. I like to use a four-week moving average on this data line on a year-over-year basis only, and as of today, this hasn’t happened. By October of this year, we will have more challenging comps to with worth, and that might be when the four-week moving average gets to 18%-22% declines year over year.
The purchase application data is down 12% week to week, ending the two-week positive streak, and it’s down 15% year over year. The four-week moving average is negative at 12.75% year over year, which is about 5.25%-9.25% better than I thought with rates this high.
Obviously, from my housing work, you can tell I haven’t been a fan of this housing market once it became apparent the housing shortage was getting worse in 2021. I talked about needing higher rates to cool things down and the cool-down is happening, but not fast enough. I am more concerned that the economic data, which is getting softer, will send bond yields lower and take rates down with it before we have a real shot to get real inventory growth.
Again, I know this is a first-world problem to have. However, I am just staying consistent with my economic work model for the years 2020-2024: the only thing that can make total home sales fall below 6.2 million is if home-price growth is over 23% and then rates rise. We have that happening currently, so the need to create more inventory and days on the market has to benefit here. A balanced market is the best housing market and we don’t have one today; it’s still a savagely unhealthy housing market.


Hi Logan, thanks for posting this. I’m curious how much a movement into ARMs is helping to keep demand supported at these higher rate levels. And down the line, as non bank originators get more desperate for business, maybe we see teaser time periods shorten and then our supply comes years down the line when those rates become less affordable (sounds familiar I know). In the meantime though, I don’t see how higher rates need to cool market prices. Yes, they should slow demand all else equal, but shouldn’t they also incentivize home owners locked into ~3% rates to stay in their homes, even with the HPA they have built up? They may be able to access cash via a HELOC or some other method that won’t completely ruin the affordable situation they have in place.
Arm loans are growing but are still a smart part of the demand curve. During the bubble years, over 30% of the loans were done with an Arm product; now, it’s still under 10%. Also, the QM laws prevent teaser loans from being done with legal protection. Traditionally, higher rates in the past do two things. Price growth cools down, and it creates more days on the market.