


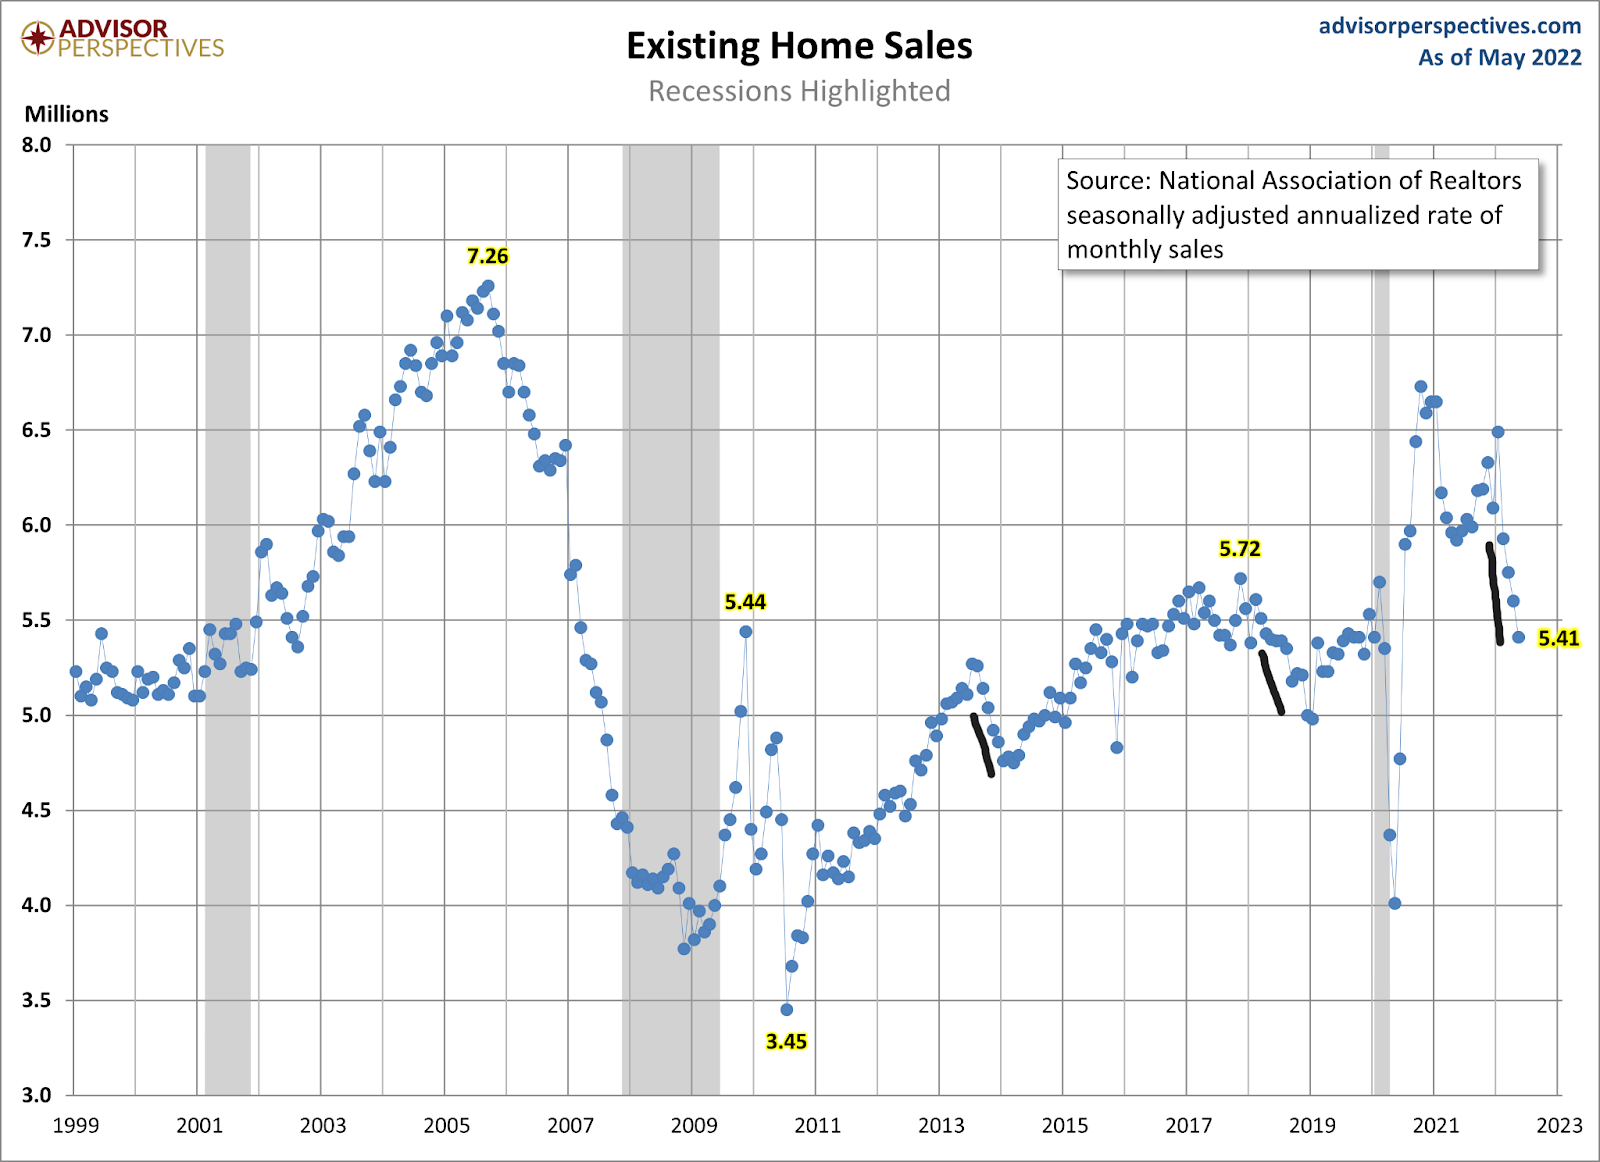
The housing nightmare continues. The National Association of Realtors (NAR) reported that existing home sales for April came in at 5.41 million, down 3.4% from the previous month and 8.6% from last year. But, the savagely unhealthy data line was that home prices are up 14.8%.
Now that we are almost in July, we can safely say the premise that once mortgage rates hit 4%, the mass panic selling of American homeowners who need to get out at all costs, driving total inventory up in the millions, hasn’t happened. In truth, that was always a terrible premise.
My nightmare scenario, on the other hand, has happened and this is bad news for everyone. Total housing inventory has collapsed to all-time lows since 2020 and because this happened during the years 2020-2024, it created forced bidding and drove prices well above my 23% five-year home-price growth model in just two years.
Now that mortgage rates have risen, demand is getting hit, while we are still showing 14.8% home-price growth data. YIKES!
NAR Research: The median existing-home price for all housing types in May was $407,600, up 14.8% from May 2021 ($355,000), as prices increased in all regions. This marks 123 consecutive months of year-over-year increases, the longest-running streak on record.
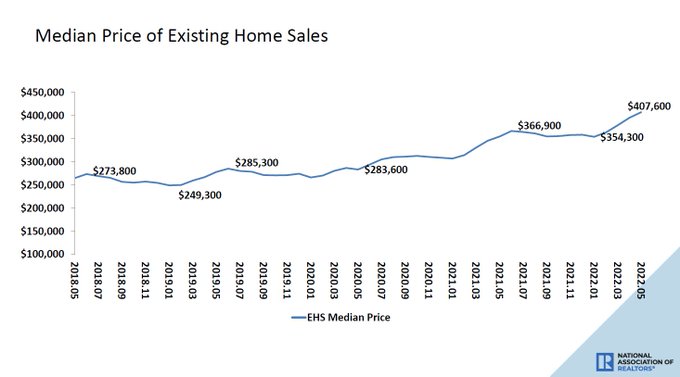
Since the summer of 2020, I have truly believed that once the 10-year yield broke over 1.94% — which means 4% plus mortgage rates — the housing narrative would change. Home prices have escalated out of control since then, creating more rate move impact damage than it would have traditionally.
Whenever rates rise, we see it impact demand, and mortgage rates are at 6% and no longer at 3%. This is real demand destruction; prices and rates are a double whammy and why I have stressed we need to get inventory higher as soon as possible. The only way this happens is higher rates.
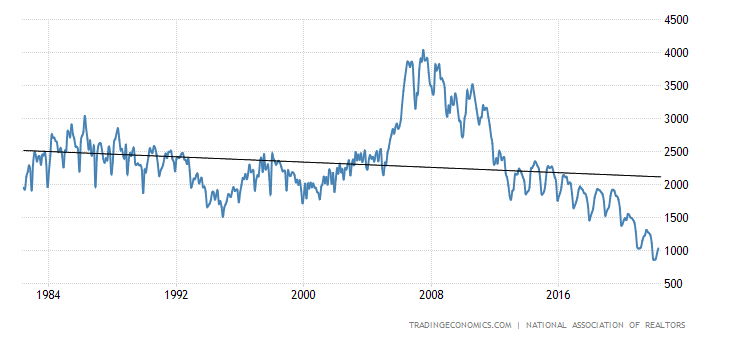
Since March of this year, housing demand has been falling more and more, but inventory is still below the 2010, 2013, 2016, and 2019 levels, which is a nightmare. Because housing is shelter, people don’t sell their homes to be homeless; it’s where they live. When you’re trying to sell your home, naturally, you’re a homebuyer too.
Rates have risen at the fastest pace ever, which makes houses more expensive, so in theory, some homebuyers can’t move. Home sellers with high equity aren’t as sensitive to higher rates because they bring a more significant down payment. Inventory skyrocketing back toward historical norms of 2 million to 2.5 million, which I would find to be the best thing ever for housing, is not happening this year.
NAR Total Inventory Data Back To 1982:
Getting to that historical inventory level will take more time. I have stressed that housing doesn’t move like the stock market. Homeowners are in a better financial position than stock traders, which is why the idea of mass panic selling doesn’t reflect housing reality. You don’t get a margin call at noon and are forced to sell your house in seconds. A real estate investor, on the other hand, doesn’t have that type of shelter relationship with a home, that a homeowner does.
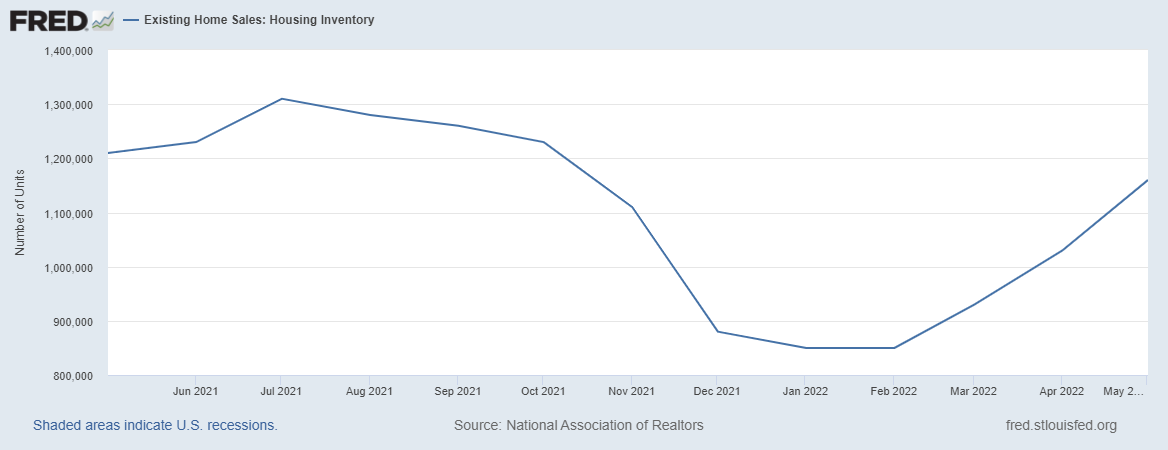
The goal is simple: We need total housing inventory to reach a range of 1.52-1.93 million to return to normal. Currently, we are at 1.16 million. Weakness in demand, time and the massive hit to affordability will get us there, but not at the speed people promoted last October.
Remember, inventory is very seasonal, and in the next few months, the seasonal inventory will fade, but before that happens we should still break over the previous year’s high. We should all be rooting for more inventory to end this madness.
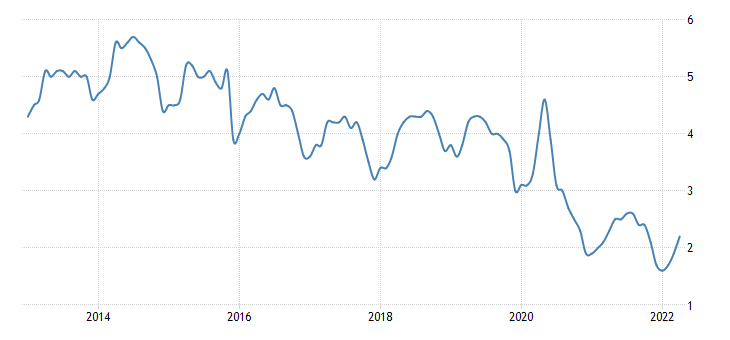
Regarding the monthly supply for housing, we want this to get above four months as soon as possible. This would be a more traditional level for the housing market; we are making some progress here but not where we want to be yet.
NAR Monthly Supply Data Before This report
As a nice jump in monthly supply, we see the seasonal push in inventory tied to sales falling, which means the months of supply should increase. This is the best part of today’s existing home report.
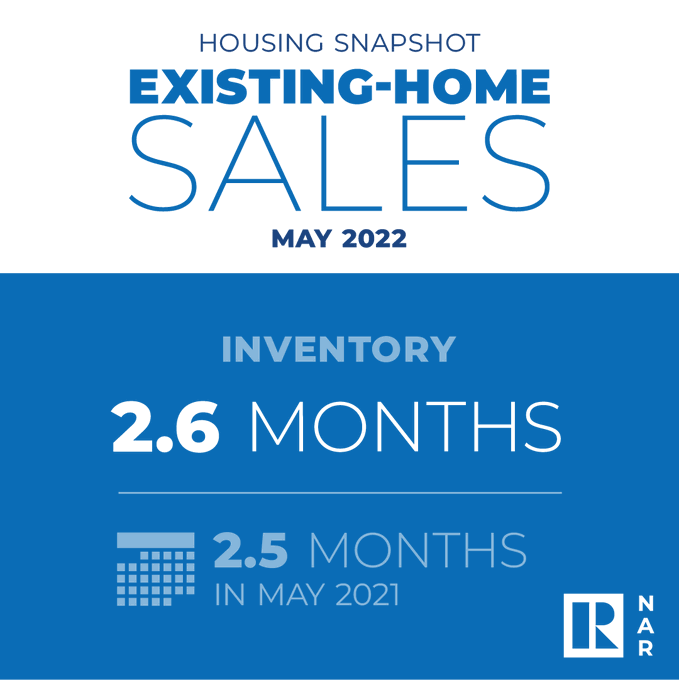
NAR Research: Total housing inventory registered at the end of May was 1.16 units, an increase of 12.6% from April and a 4.1% decline from May 2021. Unsold inventory sits at a 2.6-month supply at the current sales pace, up from 2.2 months in April and 2.5 months in May 2021.
Additional bad news from the report is the data for days on the market. The frustrating data line during this savagely unhealthy housing market has been days on the market stubbornly staying at the teenager level. We want this to go much higher to get back to anything normal.
We recently paid a severe price on the home-price growth nationally, and as long as this data line is still at a teenager level, we will not gain the balance in the housing market we need. We need home prices to fall by 17% to return to the peak growth model for the years 2020-2024 — just to have a regular market.
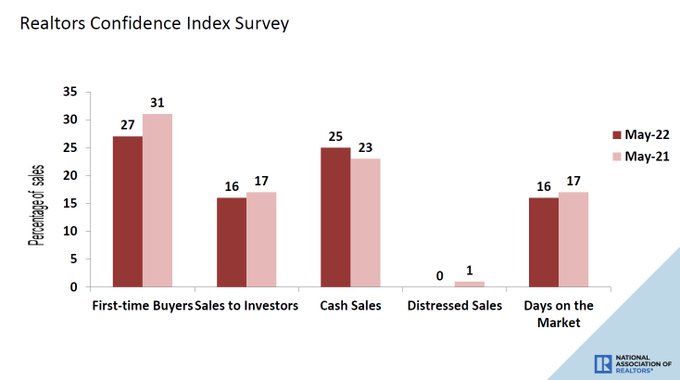
NAR Research: First-time buyers were responsible for 27% of sales in May; Individual investors purchased 16% of homes; All-cash sales accounted for 25% of transactions; Distressed sales represented less than 1% of sales; Properties typically remained on the market for 16 days.
Regarding sales trends, this data line still lags the reality of the rising rate environment, so we have a lot more room to go lower in sales. When mortgage rates were between 4%-5%, it looked more like a traditional downturn in sales with higher rates, adjusting to the massive price gains since 2020.
However, at 6% plus mortgage rates, we are seeing some real demand destruction as the most significant homebuyer in America, mortgage buyers, get hit with a double whammy.
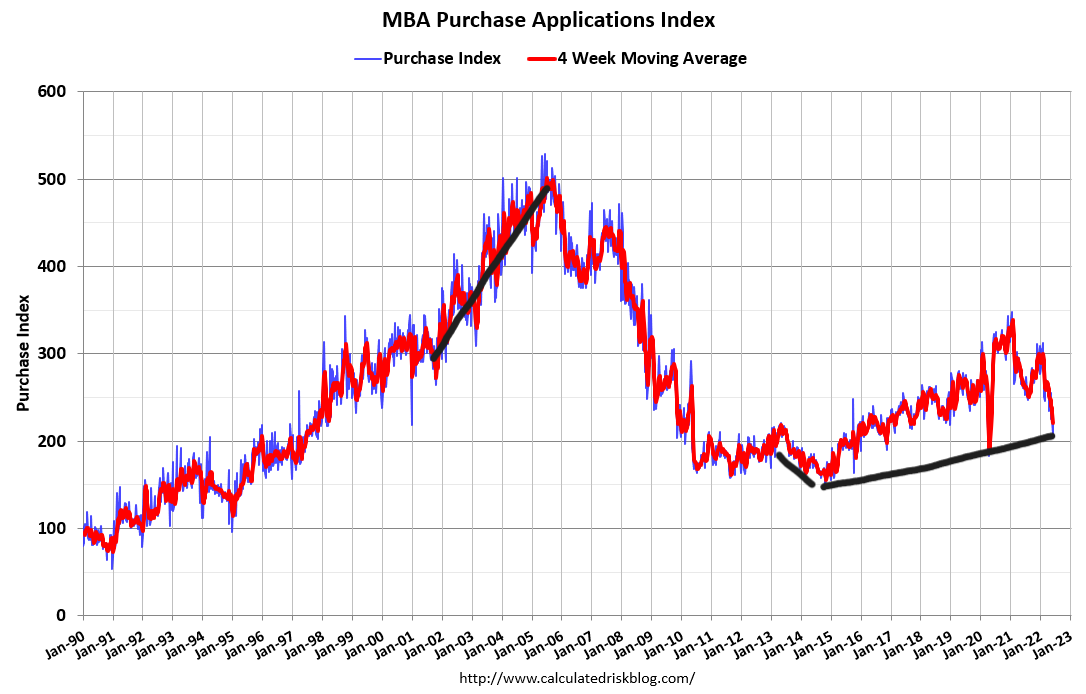
While the purchase application data four-week moving average trend hasn’t gotten to levels that I thought I would see with mortgage rates this high, which was between 18%-22% year-over-year declines, we are picking up the pace now, and that four-week average is down 16.75% year over year. Remember that starting in October this year, the comps will be much harder to work with, so year-over-year declines of 25% to 35% are in play then.
The savagely unhealthy housing market continues until we can get inventory levels to cool down pricing and hopefully reverse some of the extensive material home price damage in America post-2020. If you want more of a guide on knowing when we will see a material change in that discussion, I wrote this article recently to go over what you should be tracking. A good rule of thumb to consider is inventory between 1.52 – 1 .93 million and over four months of supply, and then we are back to a normal marketplace.
Just imagine how much more damage we would have had this year if mortgage rates hadn’t risen. I, for one, am in total agreement with Fed Chairmen Powell: we need a housing reset because nothing good happens with such savagely unhealthy home-price growth.


Does increased inventory for sure lead to falling prices? Is it possible that we see higher inventory, but from non-stressed sellers, who will only sell if they get a “decent” price? So, is it inventory we need, or stressed sellers that will, in unison, drop prices dramatically? Seems like big decreases in housing prices requires stressed sellers. And that would seem to happen with an unhealthy jobs market. Thus, are we rooting to fix an unhealthy housing market by creating an unhealthy jobs market/economy?
You don’t need to see forced credit selling to have national home price declines, but you need demand to be weaker with duration, more inventory, and days on the market to grow to allow sellers to reduce prices to sell as demand fades. Prices are still up 14.8% year over year because inventory is still too low.
This article here was created to give people an idea on when do we talk about home price declines in relationship to inventory channels gong back to the early 1980’s
https://www.housingwire.com/articles/are-home-prices-about-to-fall/