The seasonal housing inventory bottom evaded us again last week as active listings fell and new listing inventory decreased. Purchase application data rose again, with more positive than negative data in 2023. Mortgage rates didn’t move much last week, but the 10-year yield rose even though inflation data was tamer than expected, and we had a weaker retail sales report number.
Here’s a quick rundown of the last week:
- Active inventory fell 5,383 last week, and new listing data is still trending at all-time lows in 2023.
- Mortgage rates didn’t move too much last week but ended the week on a higher note at 6.50%.
- Purchase application data was up 8% weekly, and the year-over-year decline was the lowest since September 2022.
Weekly housing inventory
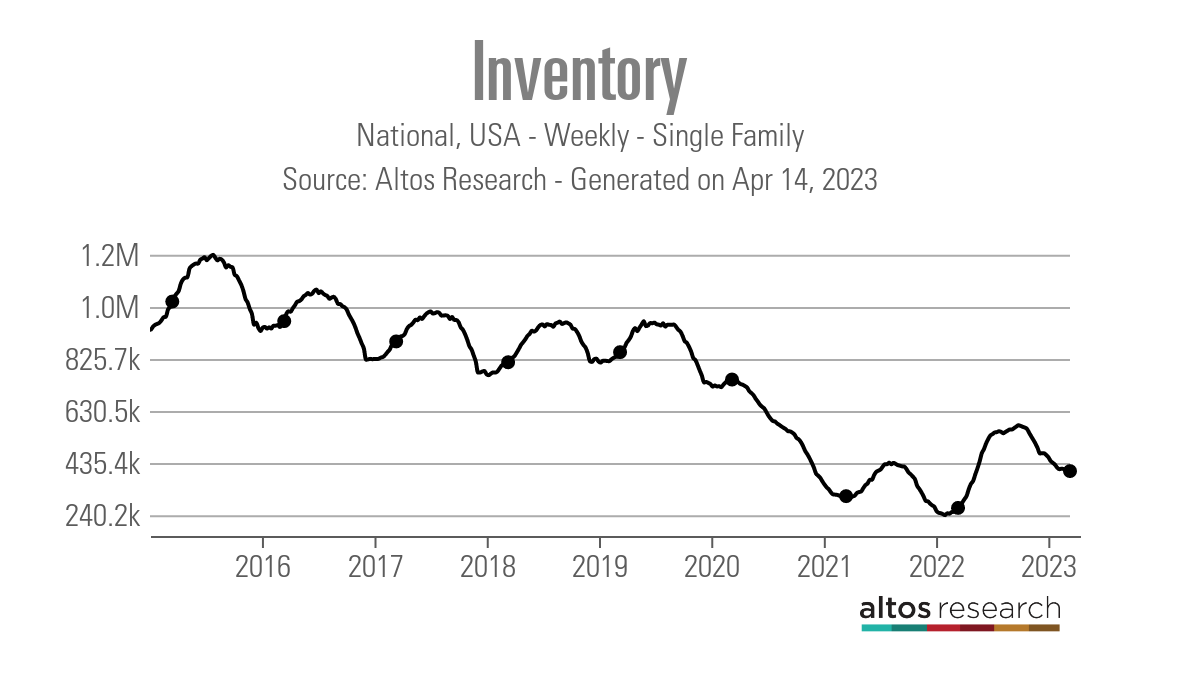
Looking at the Altos Research data from last week, the big question is: Have we seen the seasonal bottom in Inventory? The answer is no!
In fact we just made history as the seasonal inventory bottom has now broken new ground regarding how late it is in the year. I talked about this in February on the HousingWire Daily podcast, talking about why inventory is bottoming out later in the last few years. For those who might have missed that podcast, my working theory on this has to do with the purchase application data, with total active listing being at all-time lows.
- Weekly inventory change (April 7-14): Inventory fell from 410,851 to 405,468
- Same week last year (April 8-April 15): Inventory rose from 258,264 to 267,459
- The bottom for 2022 was 240,194
Now is there an Easter impact on housing inventory data? I am always skeptical of housing data around any national holiday, so let’s see what happens next week with inventory. Since the second half of 2022, after mortgage rates reached 6.25%, new listing data has been in a constant year-over-year decline and hasn’t recovered.
This is one reason housing inventory has taken so long to bottom out. Mortgage rate volatility was so wild in the second half of 2022 and even this year that some home sellers are gun-shy in listing their homes, since they will be buying another one. That’s understandable: who wants to list their home and have mortgage rates jump 1%-2% during that process?
Here are some weekly numbers to see the difference in new listings from past years over the same week. One thing to notice is that the new listing data in 2022 was higher than in 2021. This isn’t the case, of course, this year, but if there is one data line I hope surpasses 2022 levels, it is new listing data.
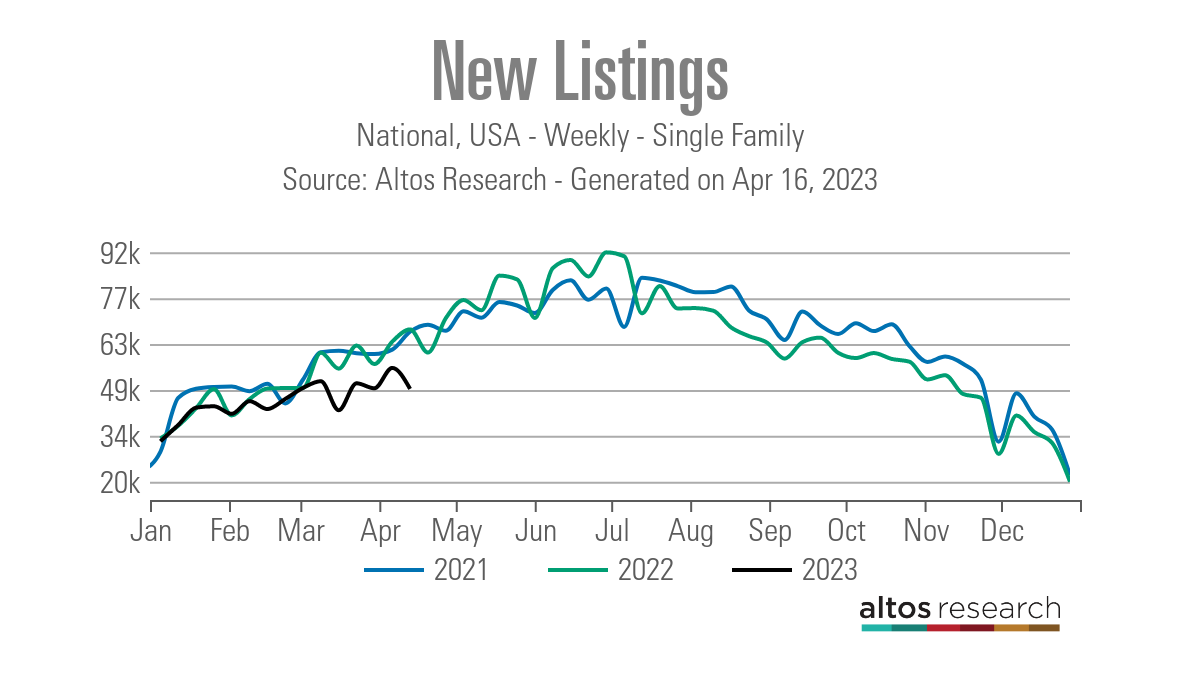
- 2021: 66,836
- 2022: 67,567
- 2023: 49,045
Compare our current new listing data to weekly new listing data in previous years when we had a more normal housing market:
- 2015: 94,470
- 2016: 86,608
- 2017: 78,886
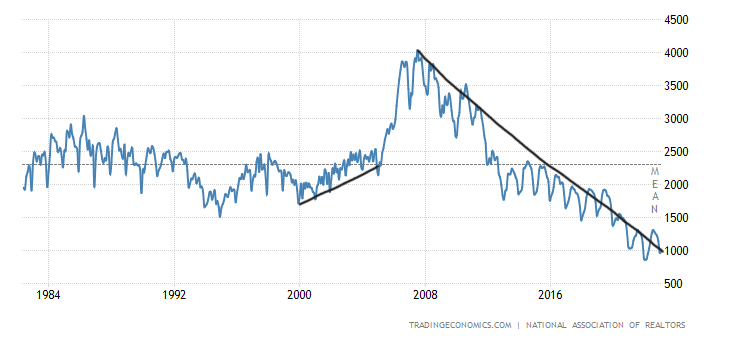
The NAR data going back decades shows how difficult it’s been to get back to anything normal on the active listing side. In 2007, when sales were down big, total active listings peaked at over 4 million. Today, even though sales are trending at 2007 levels, we are at 980,000 total active listings, per the last existing home sales. We are getting the next existing home sales report this week; just remember this inventory data is considerably lagging and also includes homes that are pending.
People often ask me why there is such a difference between the NAR data versus the Altos Research inventory data. This link explains the difference and is worth a read.
The 10-year yield and mortgage rates
Last week, mortgage rates didn’t move much; even with the two inflation reports and weaker retail sales data, rates ended up pretty much flat.
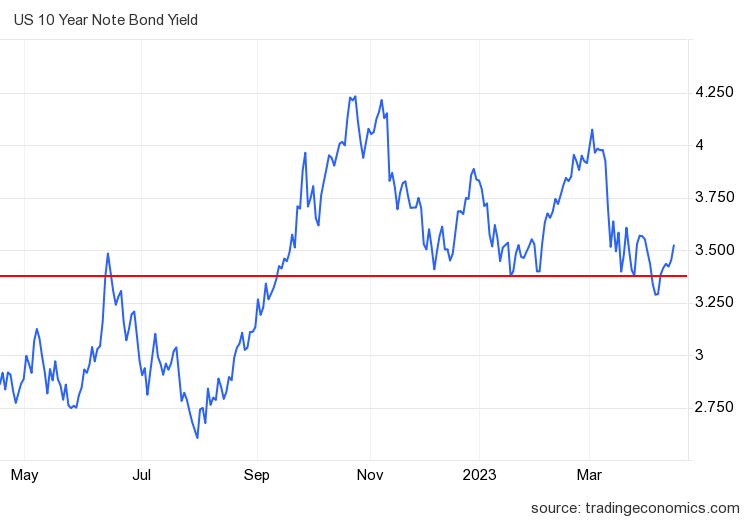
In my 2023 forecast, I said that if the economy stays firm, the 10-year yield range should be between 3.21% and 4.25%, equating to 5.75% to 7.25% mortgage rates. If the economy gets weaker and we see a noticeable rise in jobless claims, the 10-year yield should go as low as 2.73%, translating to 5.25% mortgage rates.
As you can see in the chart below, we have stayed in the firm economic 10-year yield range 100% of the time. We can also see how hard it’s been for the 10-year yield to break below the 3.37%-3.42% area with any conviction.
The labor market, while getting somewhat softer recently, hasn’t broken this year, so even with all the drama we’ve seen in 2023, the bond market channel has held within its proper channel, meaning mortgage rates should stay in the range between 5.75%-7.25%.
The banking crisis is an entirely new variable this year as short-term rates, such as the 2-year yield, have simply collapsed, assuming the Federal Reserve is going to have to cut rates faster that it wants. Even though the market stress has decreased lately, the assumption is that credit will only get tighter as the year grows. The Fed believes the banks getting tighter with their lending is like having three to four rate hikes, which means the economy will feel this stress and the Fed has to do less work.
The Fed will welcome credit getting tighter as this means their forecasted recession might finally happen. In the most recent Fed minutes, they have even used the R-word, saying it might happen later this year due to credit getting tighter.
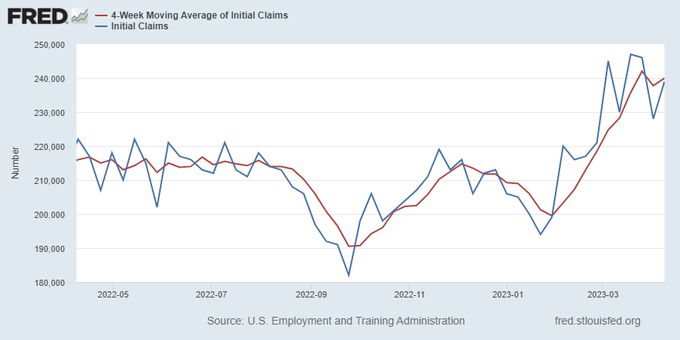
I am keeping an eye on jobless claims because I believe the Fed will pivot their language on the economy once jobless claims get above 323,000 on the four-week moving average. However, we are still far from those levels, even though it has been rising recently. Last week initial jobless claims increased by 11,000, and the four-week moving average also rose to 240,000.
Purchase application data
Purchase application data has been one of the most improved housing market data lines since Nov. 9, 2022. This is one big factor for why total housing inventory hasn’t found a bottom yet, as demand has stabilized from its waterfall dive in 2022. This also explains why the most recent existing home sales report had one of the most significant month-to-month sales prints ever. Given that rise, we should expect a month-to-month decline on the next one.
We have had three consecutive rising pending home sales reports as well.
Purchase application data rose 8% weekly in the last report, which means five out of the last six weekly prints are positive, and we are getting closer to the seasonal end of this data line. I traditionally put the most weight on this index between the last two weeks of January through the first week of May. After May, volumes traditionally fall.
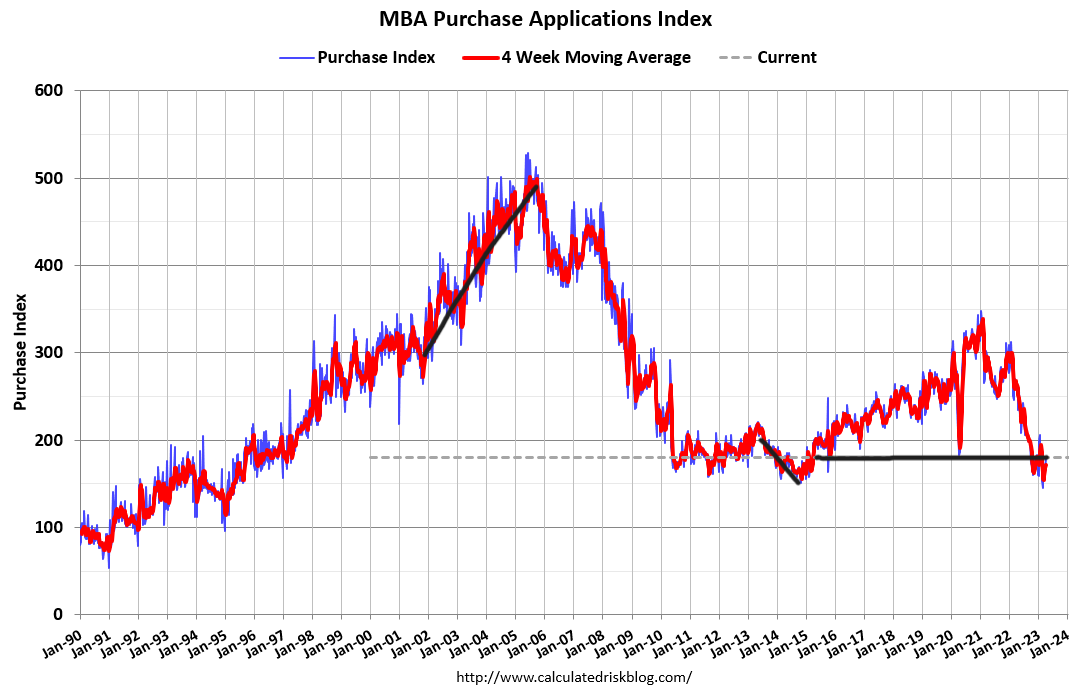
Year over year, purchase applications declined 31%, the lowest since September 2022. However, context is critical for the rest of the year. Because the year-over-year comps will get easier as the year moves on, especially in the second half of the year, we need to focus on the weekly data more. This wouldn’t be an issue in regular times, but post COVID-19, we have extreme year-over-year data that needs context.
However, with that said, 2023 year-to-date data has had eight positive prints versus five negative prints, so the data has stabilized in 2023. This is much different than the V-shaped recovery we saw during COVID-19.
The week ahead has tons of housing data
This week will be full of housing data. We have the S&P CoreLogic Case-Shiller home price index, which is lagging compared to the current data that Altos Research shows, the FHFA house price index, the builder’s confidence report, housing starts and existing home sales.
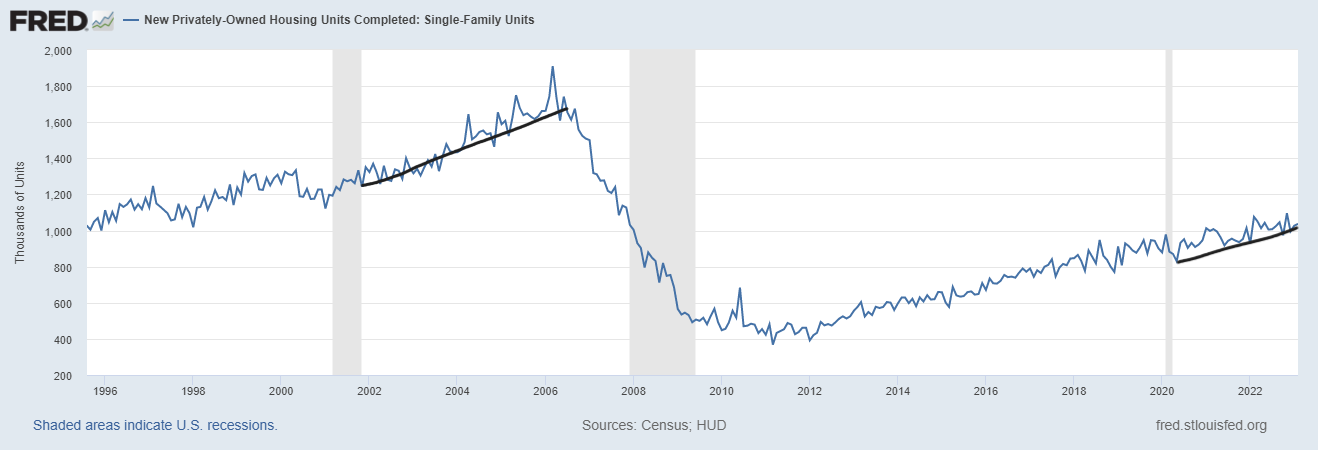
The housing recession is ongoing because housing permits haven’t been rising; we will get fresh data on this topic this week. One thing I will be keeping an eye on is whether we see more housing completion growth, because the best way to deal with rental inflation is getting more and more of those apartments up.
With rental inflation already cooling off in real time and more apartments coming online, that is the best 1-2 punch to push CPI inflation lower over the next year, as I discuss here.
The housing market tracker is designed to give an outlook for the future, and as I have written, the housing market dynamics changed starting Nov. 9. However, when mortgage rates rise to 7% and more, we have seen the weekly data get hit, impacting the sales data going out.
However, housing data has generally stabilized and we still haven’t found the seasonal bottom in inventory. New listings have been trending at all-time lows, which is what the tracker data has been telling us for some time now.