


As the industry ponders the effects of iBuyers and whether or not the consumer can be trusted to make informed decisions on their own, it is important to look at the health of housing in general.
The housing industry in every aspect, from real estate to lending to title, is generally dependent on one thing and one thing only: People need a place to live.

Columnist
The selling and purchasing of homes is the foundation of our business. Whether the home is owner-occupied or a rental, the data and information about if and when people are moving can show us a lot about the health of the industry.
The spin doctors are hard at work interpreting the numbers and applying them to the sustainability of the industry in general, but in my experience, the numbers themselves don’t lie.
There are numerous sources for graphs, charts, surveys, calculations and a seemingly infinite number of people and organizations with a stake in the housing market, so it’s difficult to cut through the noise and hear the melody. But here is how you can:
Where to go for neutral housing data
One of the potentially neutral sources for information is the Census Bureau. I know, I know… it’s a government agency and the government in itself is fraught with peril.
For those who do not know, the Census Bureau is overseen by the Economics and Statistics Administration within the Department of Commerce, and its director is appointed by the U.S. president.
The Bureau has existed since 1790 in some form with then-Secretary of State Thomas Jefferson sending U.S. marshalls out to collect data on the approximately 3.9 million people living in the country.
The Bureau went through a number of iterations over the years, and added many categories to the original six-question census, including manufacturing, agricultural, mining, fisheries, native language and others.
It did not begin collecting data on housing (other than the names of those living in households) until 1940. Since then, the real estate industry has interpreted the data and tried to predict the health of the housing market.
There are a couple of interesting statistics to look at as a baseline. The first is the actual homeownership rate. According to the census, that rate has held steady since approximately 1960.
That rate is calculated on the proportion of households that are owner-occupied and has continuously held strong in the 60-70% range throughout the years. The highest showing during the boom of 2005 at almost 70% and the lowest as expected during periods of recession at around 62%.
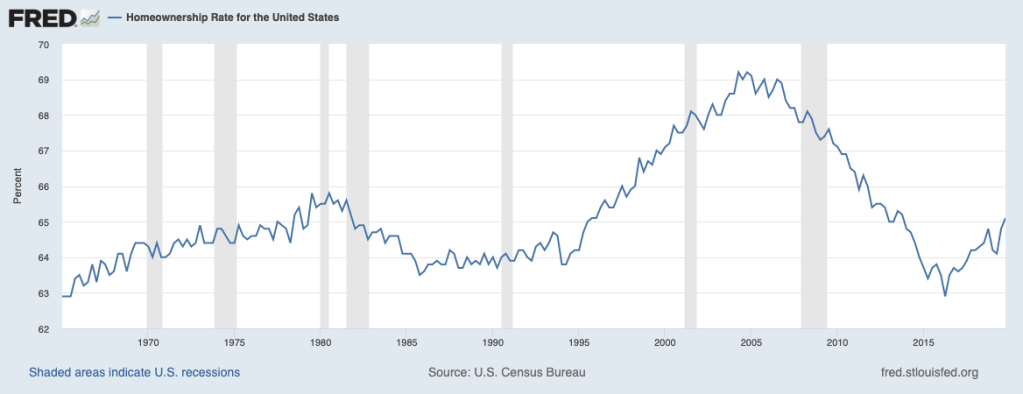
retrieved from FRED, Federal Reserve Bank of St. Louis
That’s good news…
Data that deserves a closer look
However, what the industry should really be looking at is the average number of times owners own their homes and mobility rates in the U.S.
That takes into consideration how often people move, which is a better indicator of the health of the industry and the housing market.
As of 2018, the median duration of homeownership is 10 years and growing. It has increased by three years since 2008 which means people are staying put longer.
Now, let’s compare that to the number of people actually moving each year. The Census Bureau has also asked this question since the 1940s: Have you moved in the last 12 months?
According to the Census, the answers show a pattern that cannot be ignored. In 1948, the percentage of people who had moved in the previous 12 months was a little over 40%. That fell to an all-time low of 9.8% in 2019.
The moving rate for renters hit an all-time low (since the origin of those surveys) in 2017 of 21.7%. That means that renters are not becoming buyers as quickly as they used to.
The numbers show an increase in homeownership, which is logical considering the increase in the population, but a decrease in mobility.
That’s bad news…
In 2018, movers reported moving in general for the following reasons:
- Housing related (43%)
- Family related (27%)
- Employment related (18.5%)
- Some other reason (10.6%)
The migration patterns in the Census are interesting as well, since they show a clear migration pattern in the positive for net gain in the Southern region of the U.S., and a negative for a loss in the Northeast. The people who are moving, are moving out of the Northeast and into the South!
Except for Los Angeles County. It had the highest exodus but also the highest inbound patterns and remained somewhat neutral in gain or loss. Must be the weather.
Another tremendous source for information on migration and moving patterns is the moving industry itself. northAmerican Moving Services provides data on the migration patterns of movers as well.
According to the moving company, the top outbound states for last year are Illinois, California, New Jersey, Maryland and Pennsylvania. The top inbound states are Idaho, Arizona, North Carolina, South Carolina and Tennessee.
That’s great news for the agents and businesses related to those states where the inbound patterns show gains. It’s a strong indication that the business of real estate is alive and thriving in those areas for years to come.
Between homeownership and mobility data, housing professionals have plenty of resources at their disposal to cut through the noise. At the end of the day, people need a place to live, and you can tell where they’re heading and how often. Remember, numbers don’t lie.


