


Home price growth cooled further in February, falling to an annual growth rate of 2.0%, according to the S&P CoreLogic Case-Shiller National Home Price Index, released Tuesday. The annual growth rate in January was 3.7%.
The national index came in at a reading of 293.17 in February. On a month-over-month basis, the index was up 0.2% before seasonal adjustment.
“Home price trends moderated in February 2023,” Craig Lazzara, the managing director at S&P DJI, said in a statement. “The National Composite, which had declined for seven consecutive months, rose a modest 0.2% in February, and now stands 4.9% below its June 2022 peak.”
The February data pre-dates the challenges in the commercial banking industry, which started in early March, however, industry forecasters anticipate that interest rates will remain elevated as the Federal Reserve continued to focus on its inflation-reduction targets.
“Mortgage financing and the prospect of economic weakness are therefore likely to remain a headwind for housing prices for at least the next several months,” Lazzara said.
However, despite the recent uptick, the continued low inventory conditions are expected to keep home prices elevated nationally.
“Inventory has remained low as sellers are locked into their low mortgage rates, even as many home buyers are turned away from this market due to affordability constraints amid volatile mortgage rates,” Nicole Bachaud, Zillow’s senior economist, said in a statement. “Regardless of slower than usual demand, the low inventory environment is creating more competition on fewer homes, leading to prices reversing their descent from last year’s peak, which will likely continue in the coming months. To remain in the market and stay competitive, many buyers are looking at lower priced homes to stay afloat, with homes in the lowest price tier seeing the most competition and price growth early this spring.”
The Case-Shiller home price indices for February is a three-month average of closing prices in December, January and February. Because most home sales take several months from contract to closing, the data likely includes some deals struck in October and November.
Home price growth in the 20-city composite index also slowed in February, recording an annual gain of 0.4% to a reading of 297.68. In January, the 20-city index posted an annual increase of 2.6%. Compared to a month prior, the 20-city index posted a 0.2% increase before seasonal adjustment.
The S&P CoreLogic Case-Shiller 20-city composite home price Index is a value-weighted average of the 20 metro area indices. The indices have a base value of 100 in January 2000; in other words, a current index value of 150 translates to a 50% appreciation rate since January 2000 for a typical home located within a particular market.
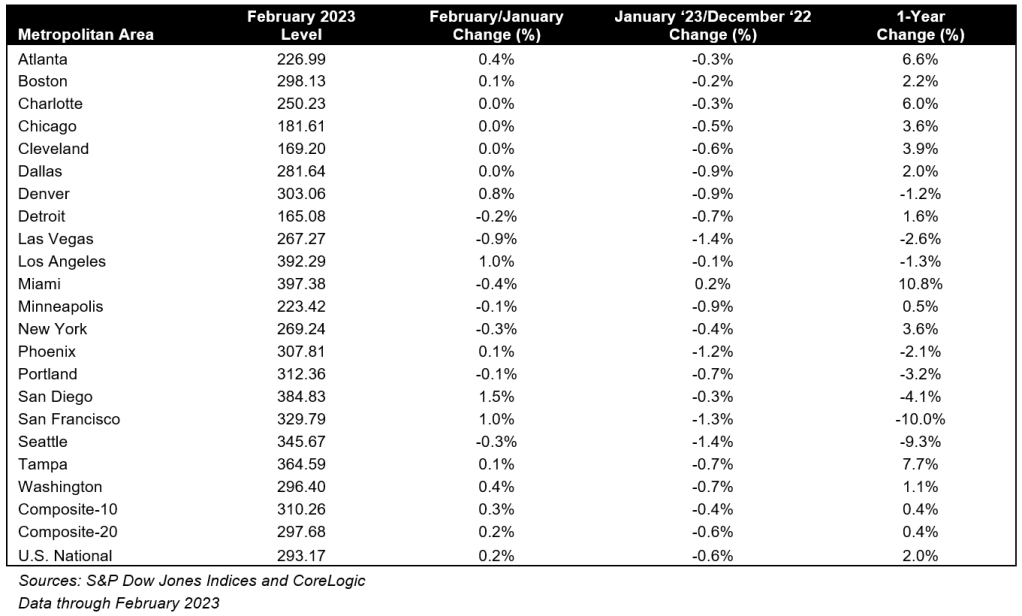
The 10-city home price index also posted a 0.4% yearly increase, down from 2.5% in January, bringing it to a reading of 310.26. Month over month, the 10-city index rose 0.3% before seasonal adjustment.
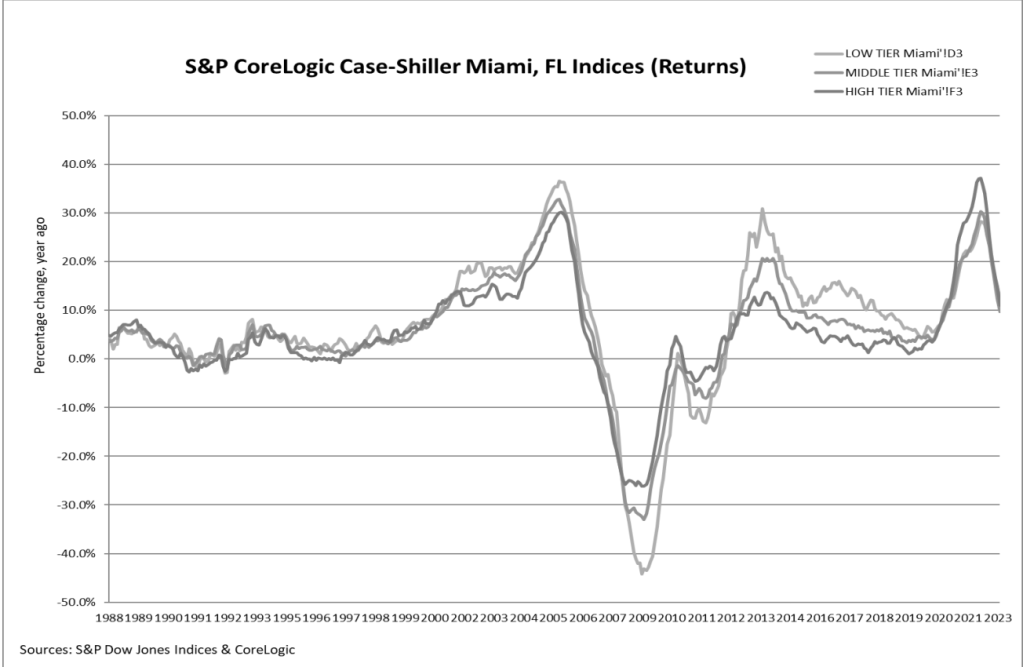
Yet again, Miami (10.8%), Tampa (7.7%) and Atlanta (6.6%) again reported the highest annual price gains among the 20-cities analyzed. All 20 cities posted lower prices in the year ending February 2023 versus the year ending January 2023, but on a month-over-month basis 12 of the 20 cities posted price gains, compared to just one in January.
At the other end of the spectrum, San Francisco (-10.0%), Seattle (-9.3%), and Portland (-4.1%), posted the largest annual decreases among the 20 cities. Phoenix, once the star of the Case Shiller index, posted a 2.1% annual price decrease in February.
“February’s results were most interesting because of their stark regional differences. Miami’s 10.8% year-over-year gain made it the best-performing city for the seventh consecutive month. Tampa (+7.7%) and Atlanta (+6.6%) continued in second and third place, with Charlotte (+6.0%) close behind. Results were different in the Pacific and Mountain time zones,” Lazzara said. “Last month, four West Coast cities (San Francisco, Seattle, San Diego, and Portland) were in negative year-over-year territory. In February they were joined by four of their western neighbors, as Las Vegas (-2.6%), Phoenix (-2.1%), Los Angeles(-1.3%), and Denver (-1.2%) all tipped into negative territory. It’s unsurprising that the Southeast (+7.8%) remains the country’s strongest region, while the West (-4.2%) continues as the weakest.”

