Much has been said in recent months about the mounting housing affordability crisis in the U.S., including blaming it for holding back home sales, suggesting how U.S. Department of Housing and Urban Development Secretary Ben Carson can solve the crisis and even questioning if President Donald Trump’s trade war will worsen the crisis.
But new data provided exclusively to HousingWire by First American Financial Corp. suggests there is no such crisis.
Are home prices increasing? Absolutely. The latest Home Price Index report from CoreLogic shows home prices increased 7% year-over-year and 1.4% monthly in March.
Are mortgage rates decreasing housing affordability? Yep. The latest Primary Mortgage Market Survey from Freddie Mac shows last week mortgage rates increased to their highest level since 2013.
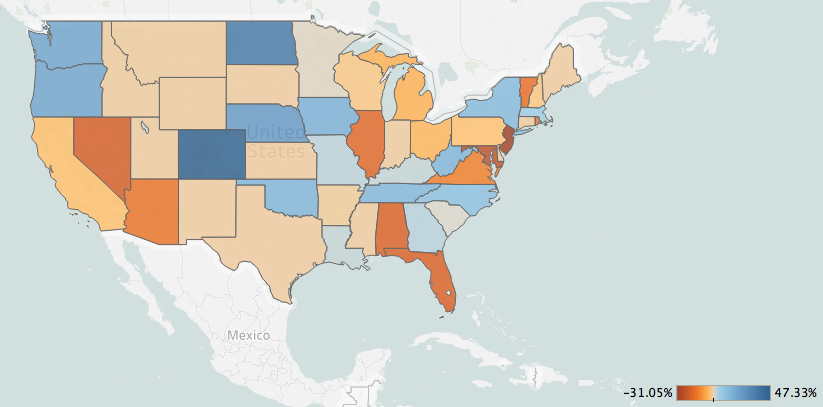
The fact is, affordability is decreasing. In fact, the map below from First American even shows Home Price Index from peak levels in 2007 range from a decrease of 31.05% in New Jersey to an increase of 47.33% in Colorado, with all other states somewhere in between. Most states have seen their Home Price Index at least return to peak levels.
Click to Enlarge
(Source: First American)
However, perhaps it hasn’t risen to the level of crisis quite yet.
The reason? Because while home prices have been increasing, so have incomes. While most states have once again reached their peak 2007 levels, incomes have far surpassed those of last decade.
Once a month, First American releases its Real Home Price Index, which measures the price changes of single-family properties throughout the U.S., adjusted for the impact of income and interest rate changes on consumer house-buying power over time. Because the RHPI adjusts for house-buying power, it also serves as a measure of housing affordability.
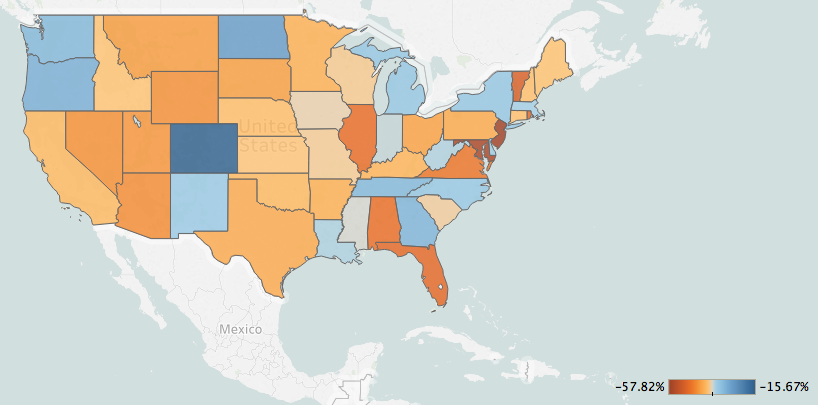
Now, new data released to HousingWire shows “real home prices,” at best, still saw decreases in the double digits from their 2007 peak years.
The states with even the least amount of decreases include Colorado, which decreased 15.67%, North Dakota with a decrease of 26.6%, Oregon with 29.56%, Georgia with 30.22% and Tennessee with 30.88%.
On the other end of the spectrum, some states are still at affordability levels significantly below their previous peaks, remember, the states above where the ones getting closest to their previous affordability peaks. The states at the other end include New Jersey, which is down 57.82%, Maryland down 56.53%, Vermont down 50.44%, Rhode Island down 48.93% and Florida down 48.78%.
Click to Enlarge
(Source: First American)
While home prices are rising, and housing is becoming less affordable, the maps show when factoring in income and other factors, affordability remains significantly below its previous peak levels before the housing crisis.


