The Federal Financial Institutions Examination Council recently released new data, reported under the Home Mortgage Disclosure Act for 2016, which shows the areas with the highest increases and decreases in mortgage growth.
HMDA requires many financial institutions to maintain, report, and publicly disclose information about mortgages.
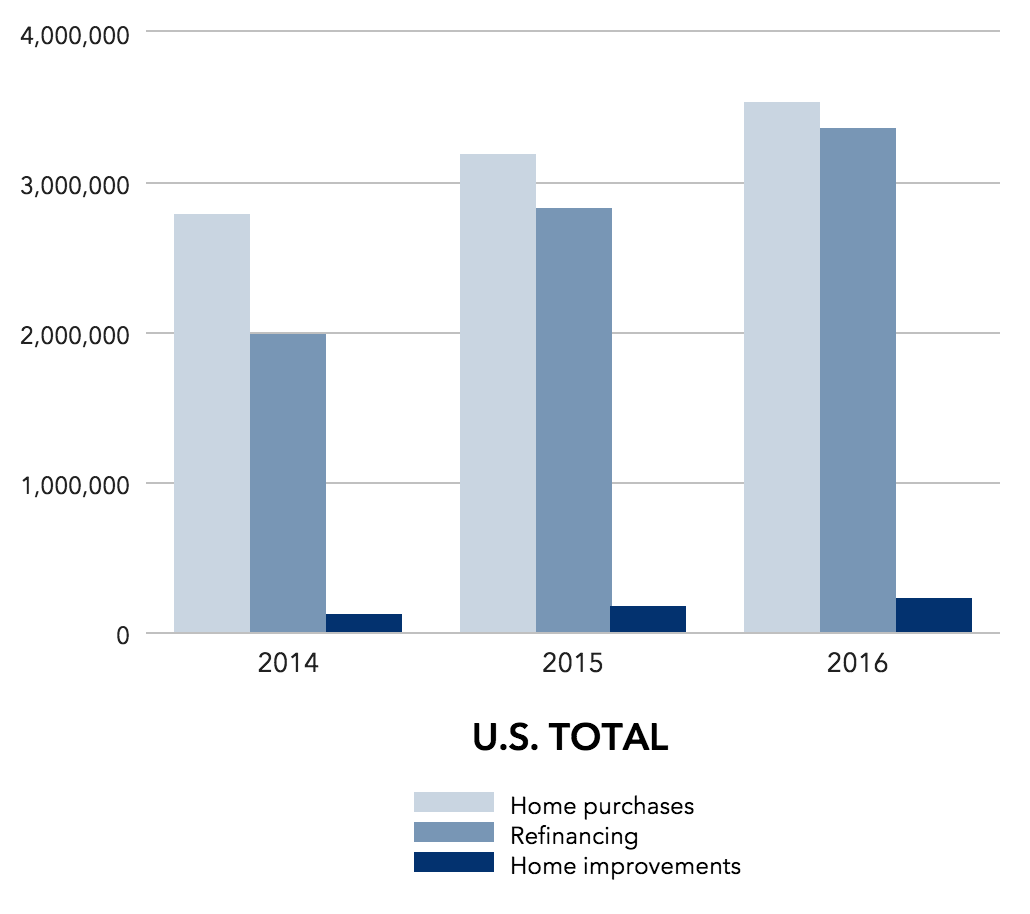
As the chart below shows, purchase, finance and home improvement mortgage volume increased over the past year. Purchase volume increased about 11%.
Click to Enlarge
(Source: HMDA)
The total number of originated loans of all types and purposes increased by almost 1 million between 2015 and 2016, or 13%. Refinance originations increased by 16%, and home purchase lending increased by nearly 11%.
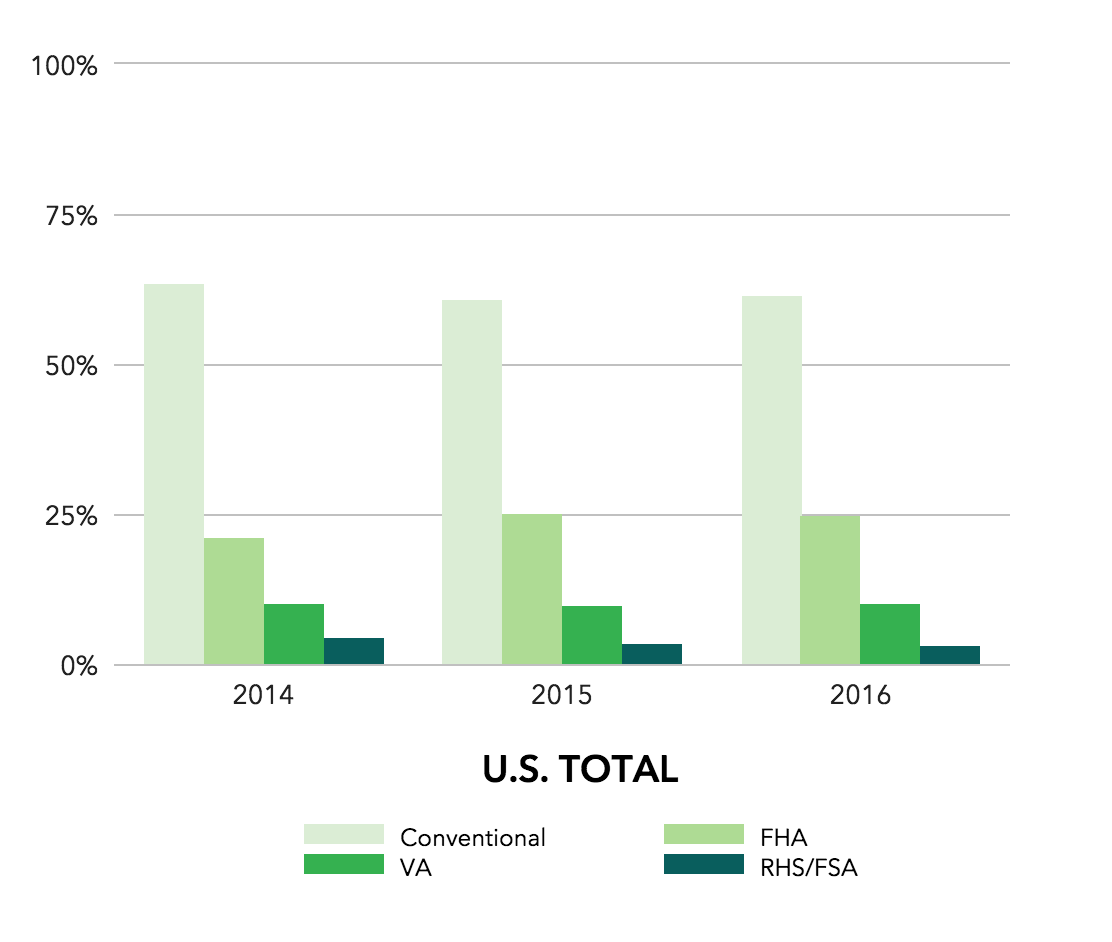
But despite this increase in overall volume, it remains spread over the same mediums. The chart below shows the shares of conventional, FHA, VA and FHS FSA loans all remain close to their 2015 values.
Click to Enlarge
(Source: HMDA)
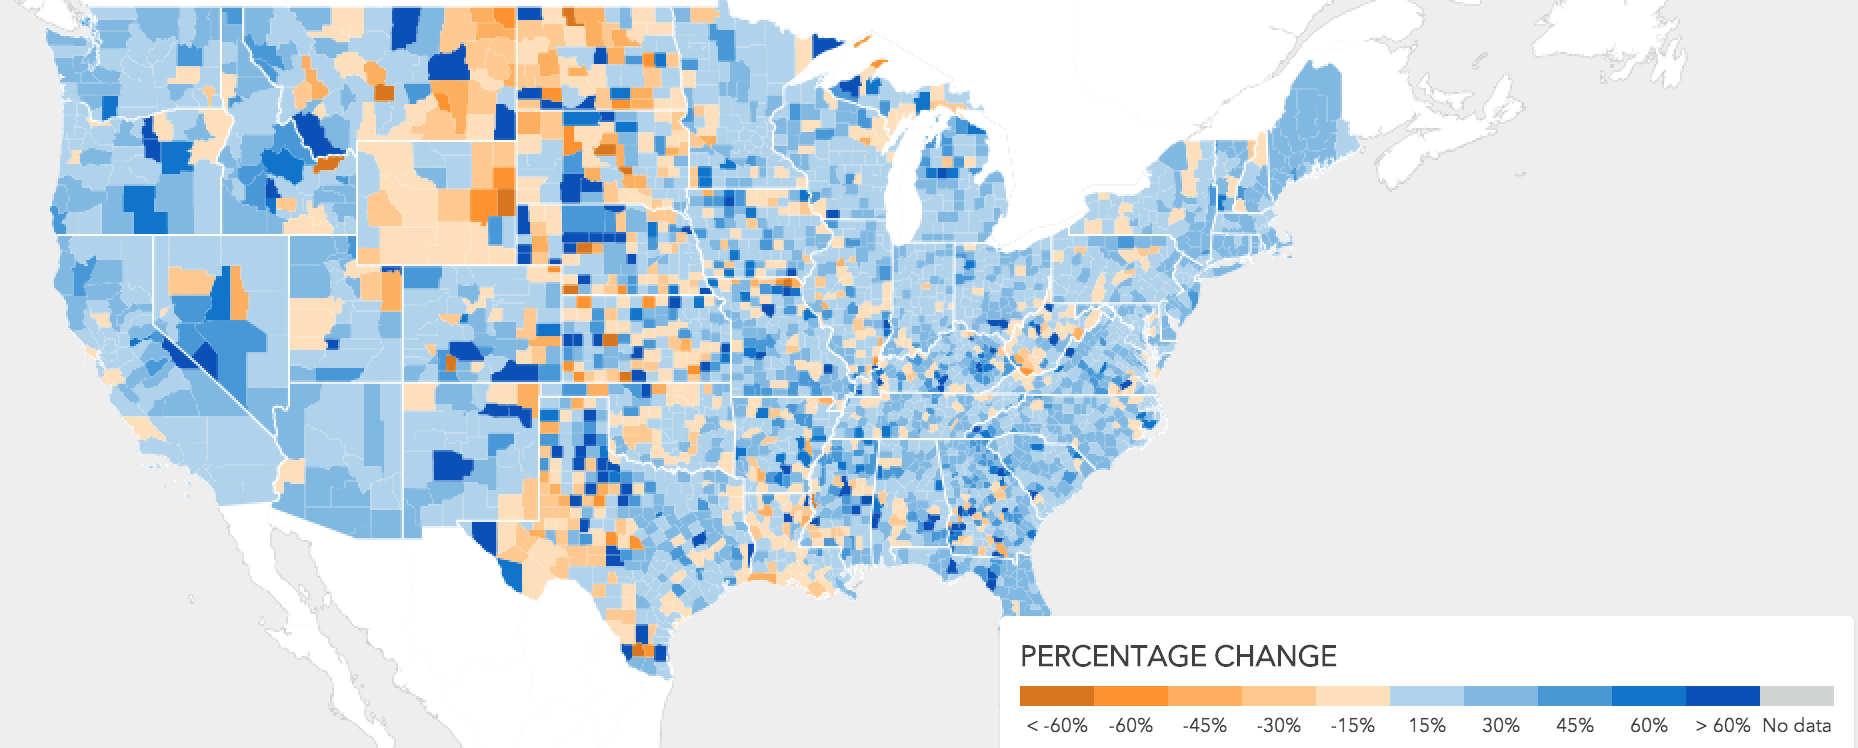
Despite the uptick in mortgage lending, the central U.S. area saw a significant drop in mortgage volume amount. Some areas even saw decreases as high as 60% from 2015 to 2016. The map shows that while the rest of the U.S. saw modest or even significant upticks in mortgage volume, for one strip down the center of the country, this was not the case.
Click to Enlarge
(Source: HMDA)
The share of home purchase loans for single family properties made to black borrowers rose from 5.2% in 2015 to 5.6% in 2016, while the share made to Hispanic-white borrowers rose from 7.9% to 8.4%, and those made to Asian borrowers increased from 5.5% to 5.7%.
The share of refinance loans made to black borrowers remained at 4.9% in 2016 and the share made to Hispanic-white borrowers remained at 6.1%. However, refinances loans made to Asian borrowers increased from 5.1% to 5.6%.
In 2016, black and Hispanic-white applicants experienced higher denial rates for conventional home purchase loans than non-Hispanic white applicants. The denial rate for Asian applicants is more comparable to the denial rate for non-Hispanic white applicants.