
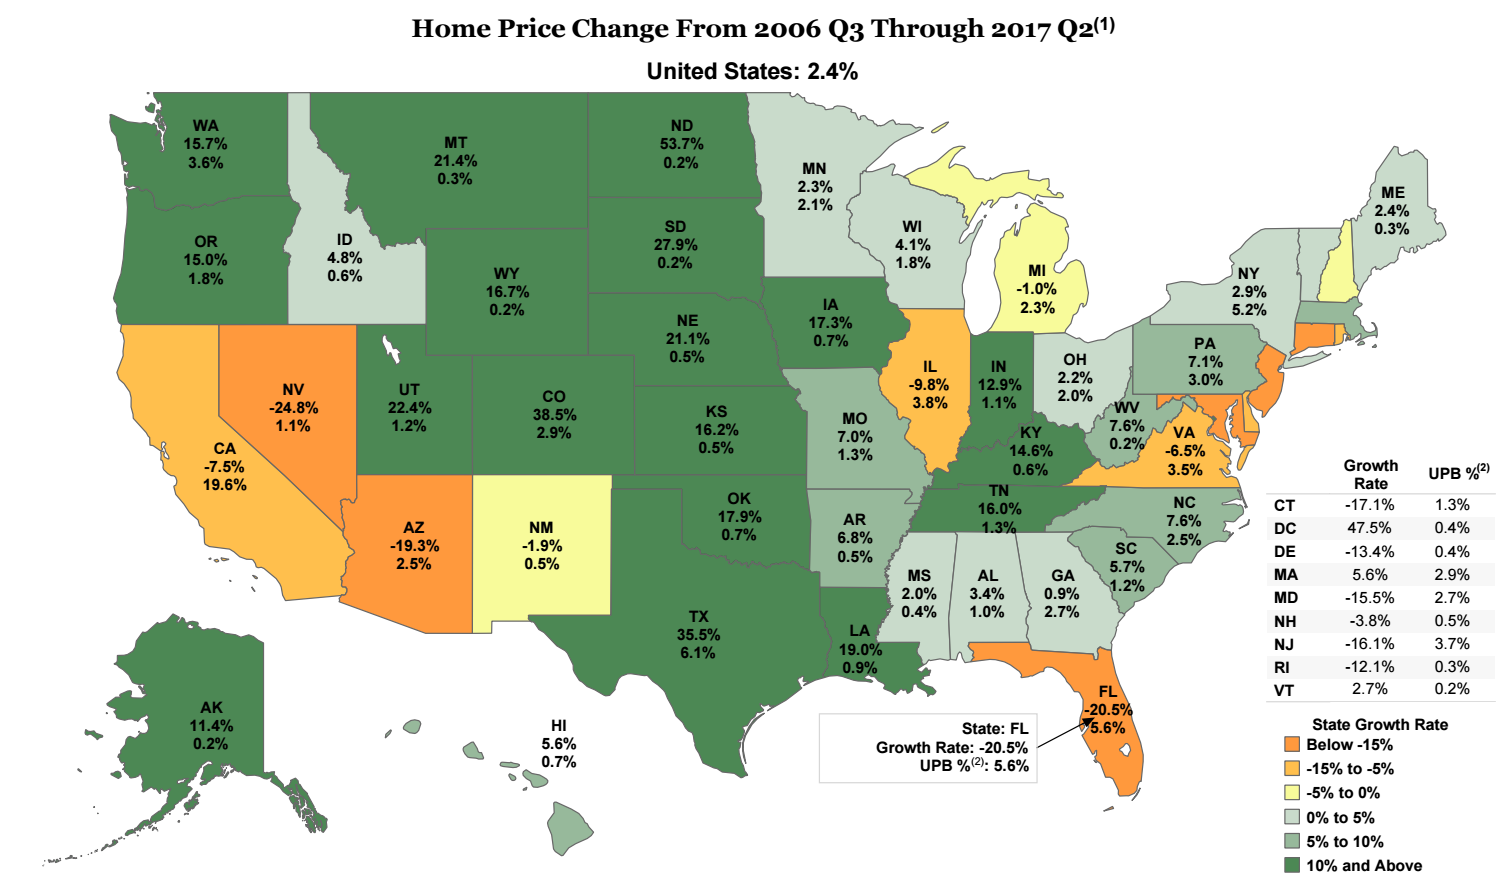
Fannie Mae released its 2017 Second Quarter Credit Supplement report when it reported its earnings Thursday, which showed home prices hit an all new high, surpassing the previous 2006 peak.
Home prices increased 2.4% in the U.S. from the previous peak in the third quarter of 2006 to the second quarter of 2017.
While prices are up overall, it varies significantly from state to state. For example, North Dakota had the highest increase, seeing a growth rate of 53.7%, while on the other end of the spectrum, the growth rate in Nevada dropped 24.8% from 2006.
Home price estimates are based on purchase transactions in Fannie Mae and Freddie Mac’s acquisition and public deed data available through the end of June 2017. UPB estimates are based on data available through the end of June 2017.
In the list below, UPB percentage refers to unpaid principal balance of loans on properties in the applicable state as a percentage of unpaid principal balance of single-family conventional guaranty book of business for which Fannie Mae has access to loan-level information.
Here are the top 10 states with the highest home price growth since the third quarter of 2006:
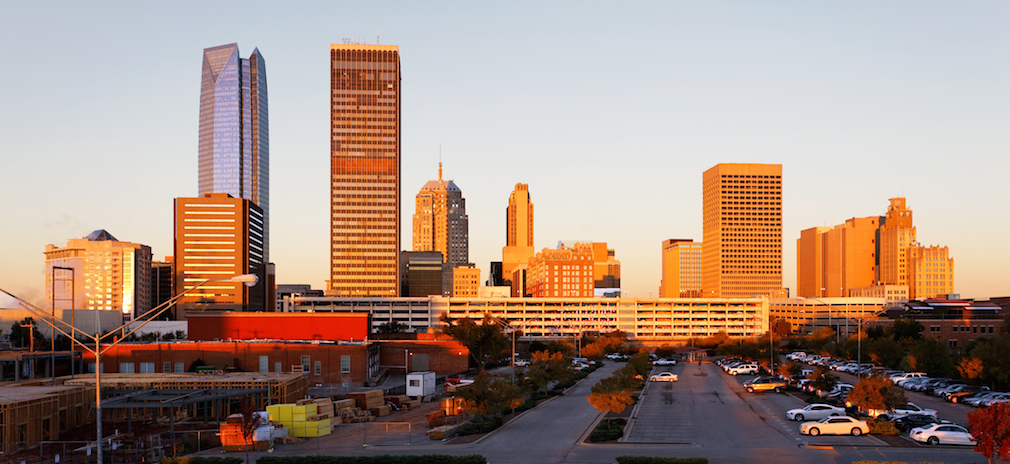
10. Oklahoma – 17.9%
Unpaid principle balance percentage: 0.7%
9. Louisiana – 19%
Unpaid principle balance percentage: 0.9%

8. Nebraska – 21.1%
Unpaid principle balance percentage: 0.5%
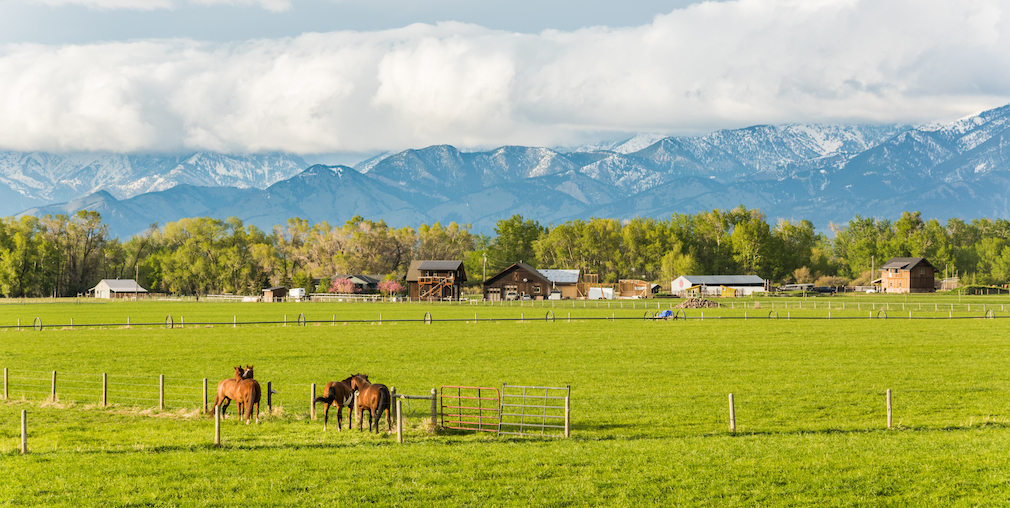
7. Montana – 21.4%
Unpaid principle balance percentage: 0.3%
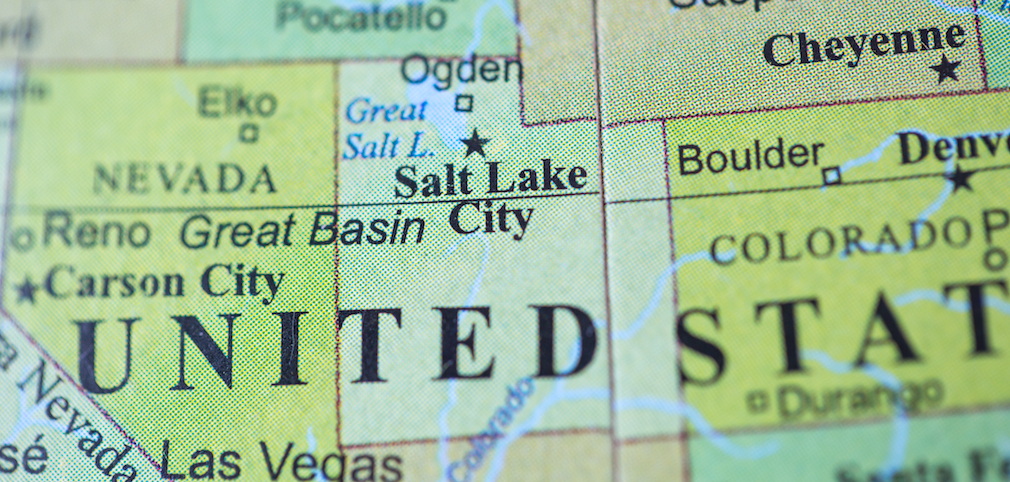
6. Utah – 22.4%
Unpaid principle balance percentage: 1.2%
5. South Dakota – 27.9%
Unpaid principle balance percentage: 0.2%

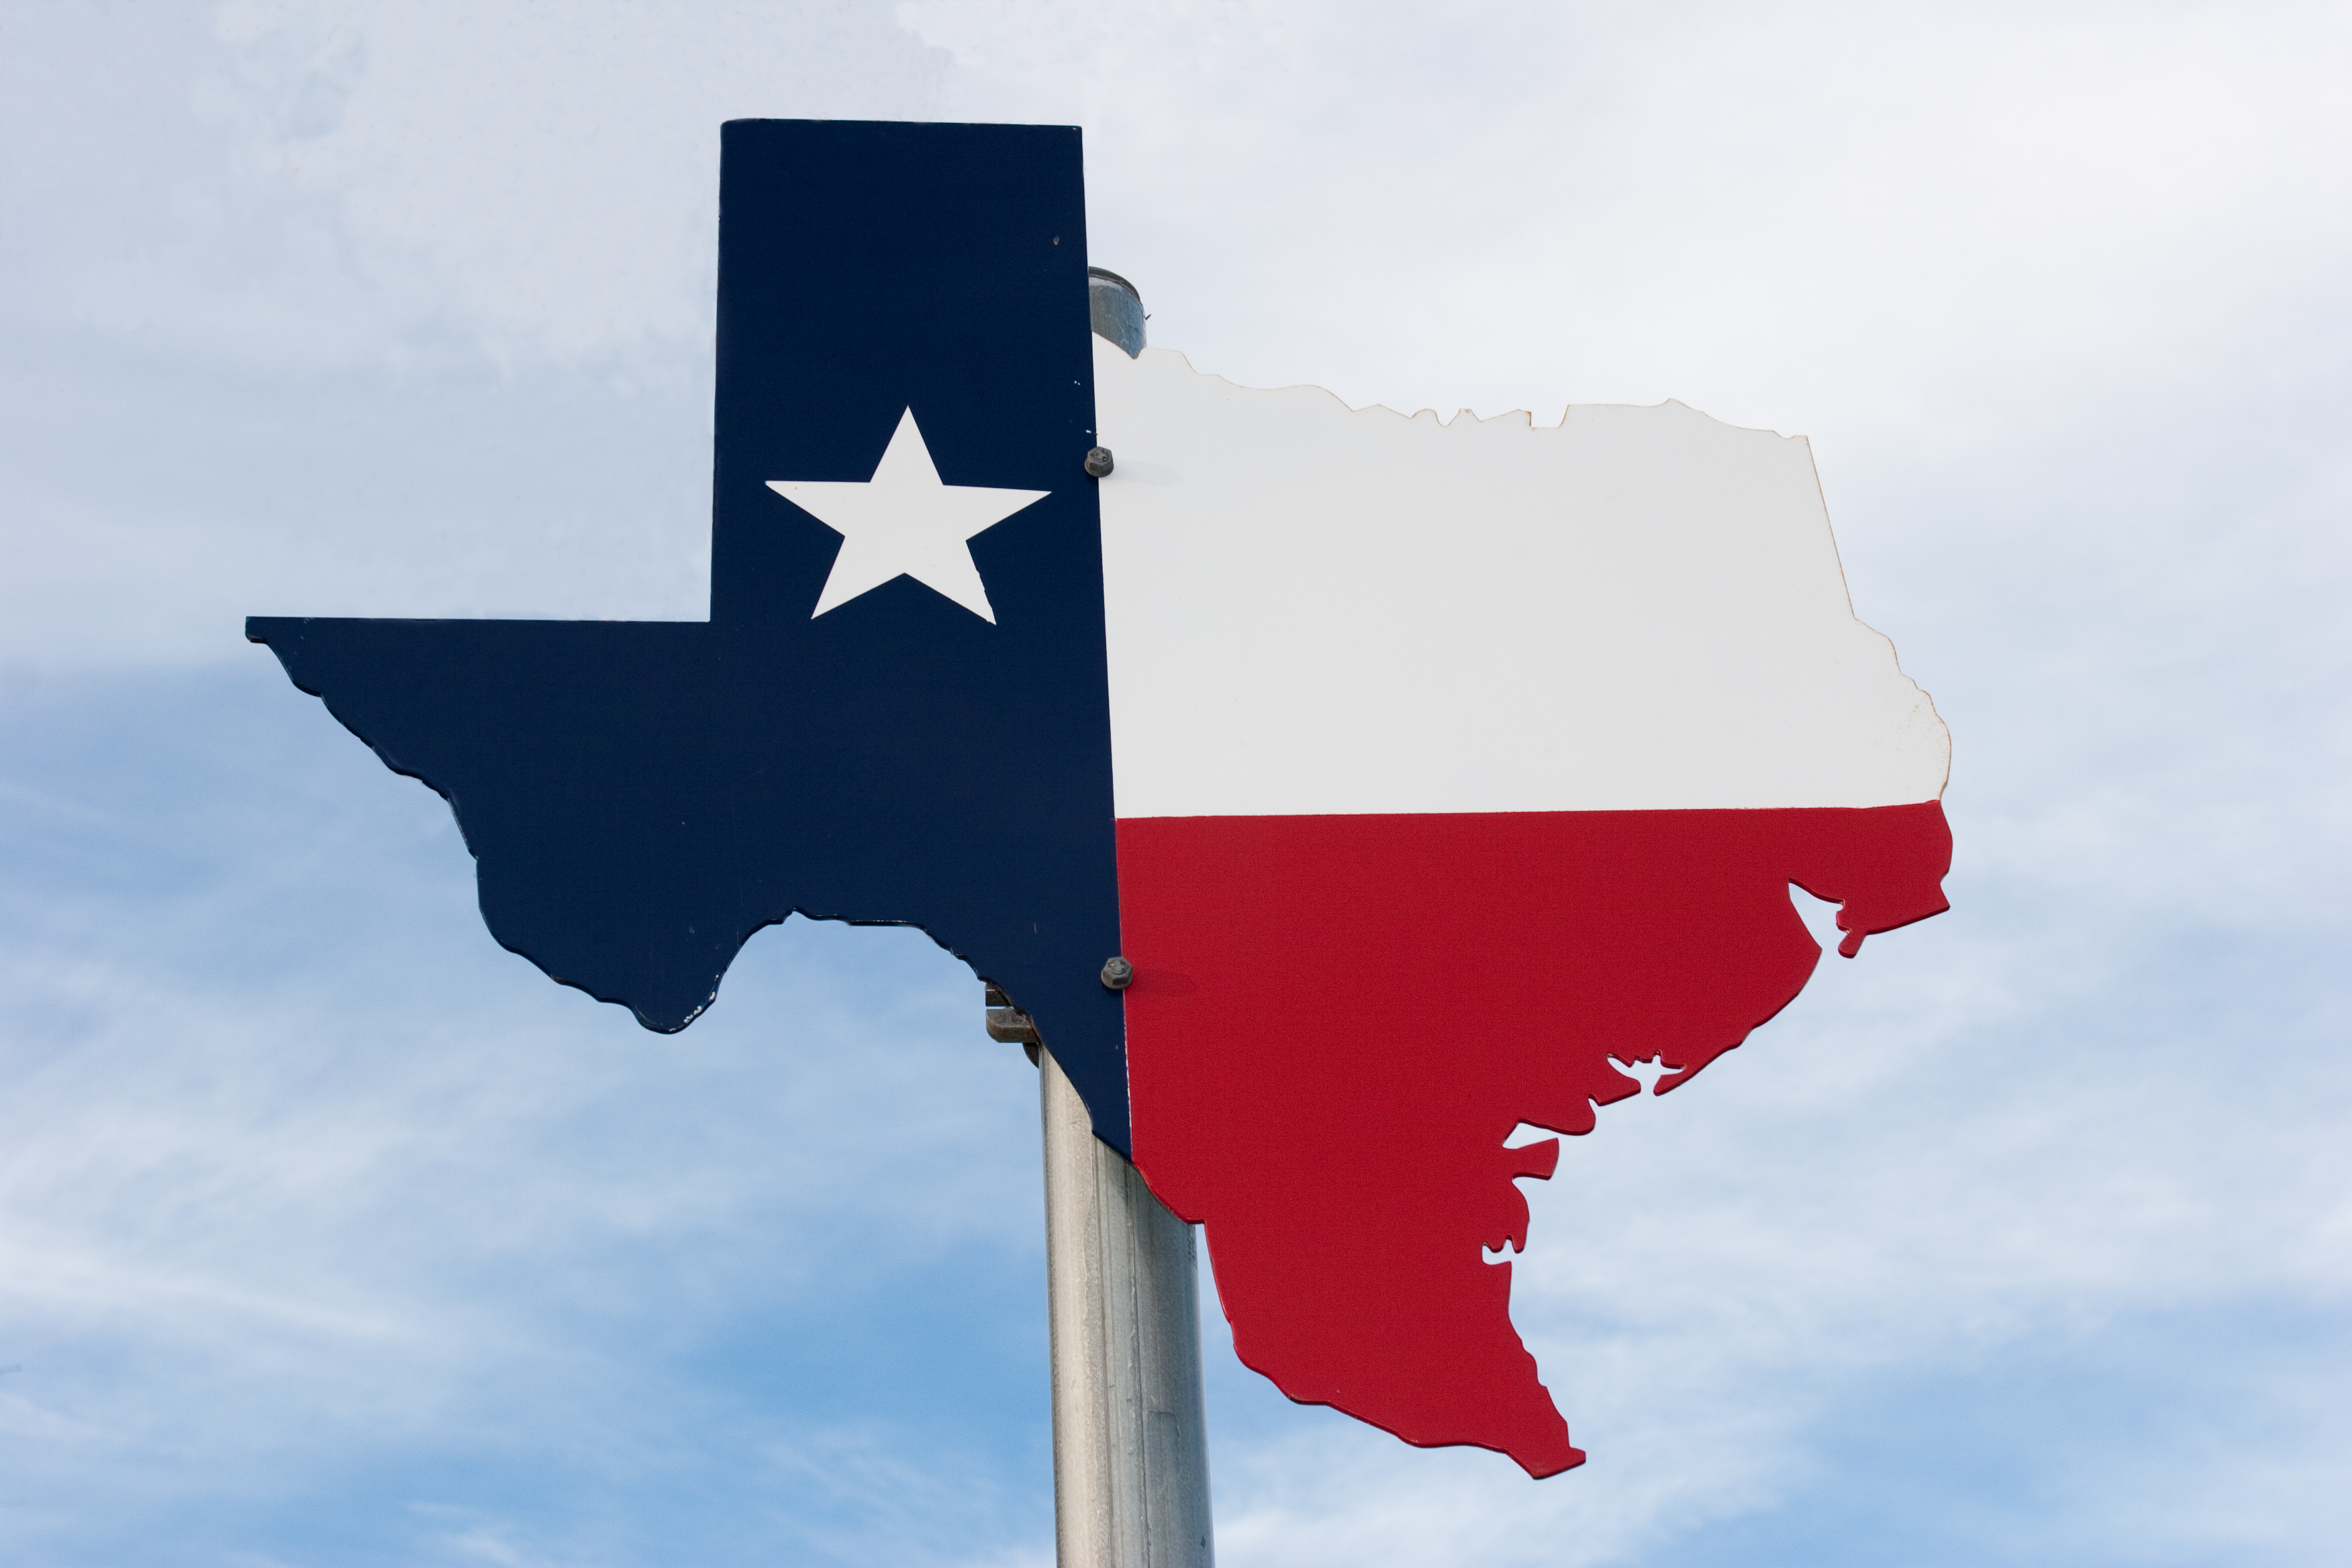
4. Texas – 35.5%
Unpaid principle balance percentage: 6.1%
3. Colorado – 38.5%
Unpaid principle balance percentage: 2.9%

2. Washington D.C. – 47.5%
Unpaid principle balance percentage: 0.4%

1. North Dakota – 53.7%
Unpaid principle balance percentage: 0.2%
The map below shows the home price growth across the U.S.
Click to Enlarge
(Source: Fannie Mae)