
As housing inventory tightens across the U.S., the need for new builds becomes more essential to the housing market, especially for first-time homebuyers.
In order to assess the current state of the new-build market, the National Association of Realtors compared building permits from 2000, 2005 and 2015.
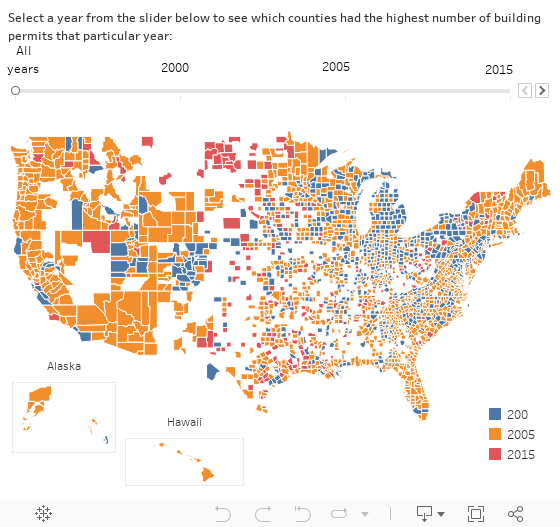
The study found that 28% of counties saw the highest number of building permits in 2000, 60% of counties saw a peak in 2005 and 2015, at 12%, saw the least number of counties with peaks in building permits.
In 2000, the counties that saw a peak were centered in Michigan, Colorado and Indiana, while in 2005 Arizona, Hawaii, Maine and Florida saw the highest share. In 2015, the District of Columbia and North Dakota held the highest share of building permits.
This chart shows when each county reached its peak share of building permits.
But how does this compare to the need for new housing units? The interactive tool below, which uses information from the U.S. Census Bureau, shows how many building permits were authorized for each county versus how many were needed.
For example, in San Francisco, 2,996 new housing units were needed to meet the need for new homes on the market, and 3,665 new units were authorized by building permits in 2015. In Dallas, the need was much higher at 15,558 new units, but 21,698 new housing units were authorized.