


Housing affordability is taking a giant hit as home prices continue to rise, even if it is at a slower pace.
According to the latest CoreLogic home price index, national home prices rose 27 weeks straight year-over-year, with home prices, including distressed sales, increasing 8.8% in May 2014 from a year ago.
As a whole, affordability is nationally down from 179.3 in May 2013 to 159.3 in May 2014, the National Association of Realtors said.
“The pace of home price appreciation is cooling off quickly as the weather warms up,” said Mark Fleming, chief economist for CoreLogic.
“May's 8.8% year-over-year growth rate is down almost three percentage points from just three months ago. The influences of modestly rising inventory and less-than-expected demand are causing price growth to moderate toward our forecasted expectations," Fleming continued.
Every single region recorded a decline in affordability from a year ago, with the West witnessing the biggest decline in affordability as a result of having the largest price gain at 8.4%.
And the severity in this decline can best be seen in this chart.
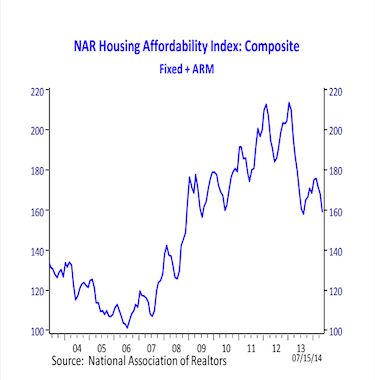
(source: NAR, click for larger image)
Meanwhile, homebuyers are quickly feeling the impact of this, with more people holding off purchasing homes due to rising home prices.
"Comments from agents in June suggest that buyers are growing increasingly discouraged by economic and employment conditions, and as a result, have made the decision to hold-off on purchases—particularly at current prices," Credit Suisse reported in their monthly traffic survey of real estate agents.


