Home prices moderately increased in the third quarter of 2018, rising only 1.3% month over monnth but still up 6.3% from the same quarter last year.
Home prices increased in September, rising only 0.2% from August, according to the latest monthly House Price Index from the Federal Housing Finance Agency.
The FHFA monthly HPI is calculated using home sales price information from mortgages sold to, or guaranteed by, Fannie Mae and Freddie Mac. Because of this, the selection excludes high-end homes bought with jumbo loans or cash sales.
FHFA Supervisory Economist William Doerner said home prices continued to rise in the third quarter, but their upward pace is slowing down.
“Rising mortgage rates have cooled down housing markets—several regions and over two-thirds of states are showing slower annual gains,” Doerner said.
Nationally, home prices in all 50 states and the District of Columbia increased since the third quarter last year.
The states with the largest gains were Idaho at 15.1%, Nevada at 15%, Washington at 10.6%, Utah at 10% and Colorado at 9.2%.
The states that showed the least amount of annual appreciation are Alaska at 0.2%, North Dakota at 1%, Louisiana at 1.5%, the District of Columbia at 1.6% and Connecticut at 2.2%.
According to FHFA, home prices rose in 99 of the 100 largest metropolitan areas in the U.S. over the last four quarters.
Furthermore, annual price increases were greatest in Boise City, where prices increased by 20.1%. However, prices were weakest in Honolulu, where they fell by 5.2 %.
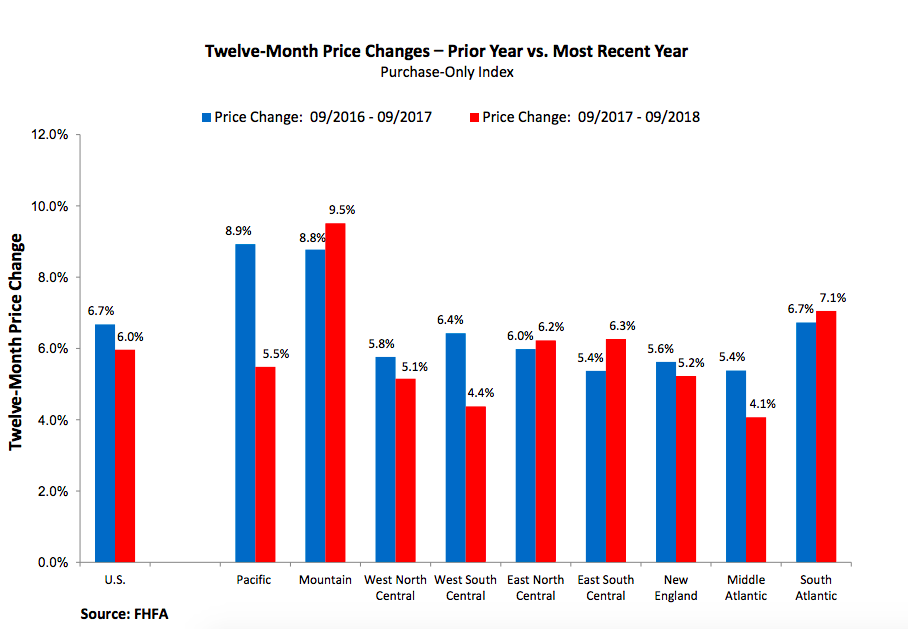
The report also explains across the nine census divisions, the Mountain division once again saw the strongest appreciation growth, climbing 8.9% in the last year and increasing 1.5% in the third quarter of 2018.
Notably, annual house price appreciation was also weak in the New England, Middle Atlantic and West South Central divisions. In these areas, house prices rose less than 5% since the third quarter in 2017.
The chart below compares 12-month price changes to the prior year:
Click to enlarge:
(Source: FHFA)