Existing home sales fell in today’s report, which isn’t surprising, but one headline that shocked some people was that home prices are still up year over year, even with higher inventory and higher mortgage rates.
From NAR: The median existing home price for all housing types in March was $393,500, an increase of 4.8% from the previous year ($375,300). All four U.S. regions registered price gains.
In an interview today with Yahoo Finance, I discussed how home prices are still rising this year. Supply being near all-time lows is one thing, but existing home sales aren’t crashing like they did in 2022. The supply and demand equilibrium changed after November 2022, and that itself has kept prices rising even with existing home sales still trending at the lowest levels ever for the third calender year.
Of course this isn’t the healthiest housing inventory story. But one positive reason for the low inventory is that homeowners have great financials and aren’t being forced to sell their homes out of stress. This is a byproduct of the qualified mortgage rule of 2010, which has been a game-changer not only for the housing market but for the overall U.S. economy.
NAR: Total existing-home sales receded 4.3% from February to a seasonally adjusted annual rate of 4.19 million in March.
This existing home sales print is slightly above the level I was looking for, but a miss for general expectations. This scenario is similar to 2023 when rates fell. We got one big existing home sales report, and then as rates rose, sales fell the rest of the year. This is why I recently talked about whether existing home sales have already peaked for the year at 4.38 million.
The one thing that is positive this year which is different than last year is new listing data is rising year over year, nothing spectacular, but it’s a positive story for housing This means we have more sellers that will be buyers in 2024. So, this might give a bit more cushion to demand as long as rates don’t keep heading higher. However, that hasn’t been the case so far in 2024.
NAR: Total housing inventory registered at the end of March was 1.11 million units, up 4.7% from February and 14.4% from one year ago (970,000).
NAR tracks inventory different than we do here at HousingWire: they have 1.11 million active listings per the last report, we have 526,000 per our last Housing Market Tracker article. Historically, going back to 1982, the average inventory range is between 2 and 2.5 million, and in 2007, it peaked at 4 million. So, no matter how you measure it, the inventory data is far from ordinary.
NAR: First-time buyers were responsible for 32% of sales in March; Individual investors purchased 15% of homes; All-cash sales accounted for 28% of transactions; Distressed sales represented 2% of sales; Properties typically remained on the market for 33 days.
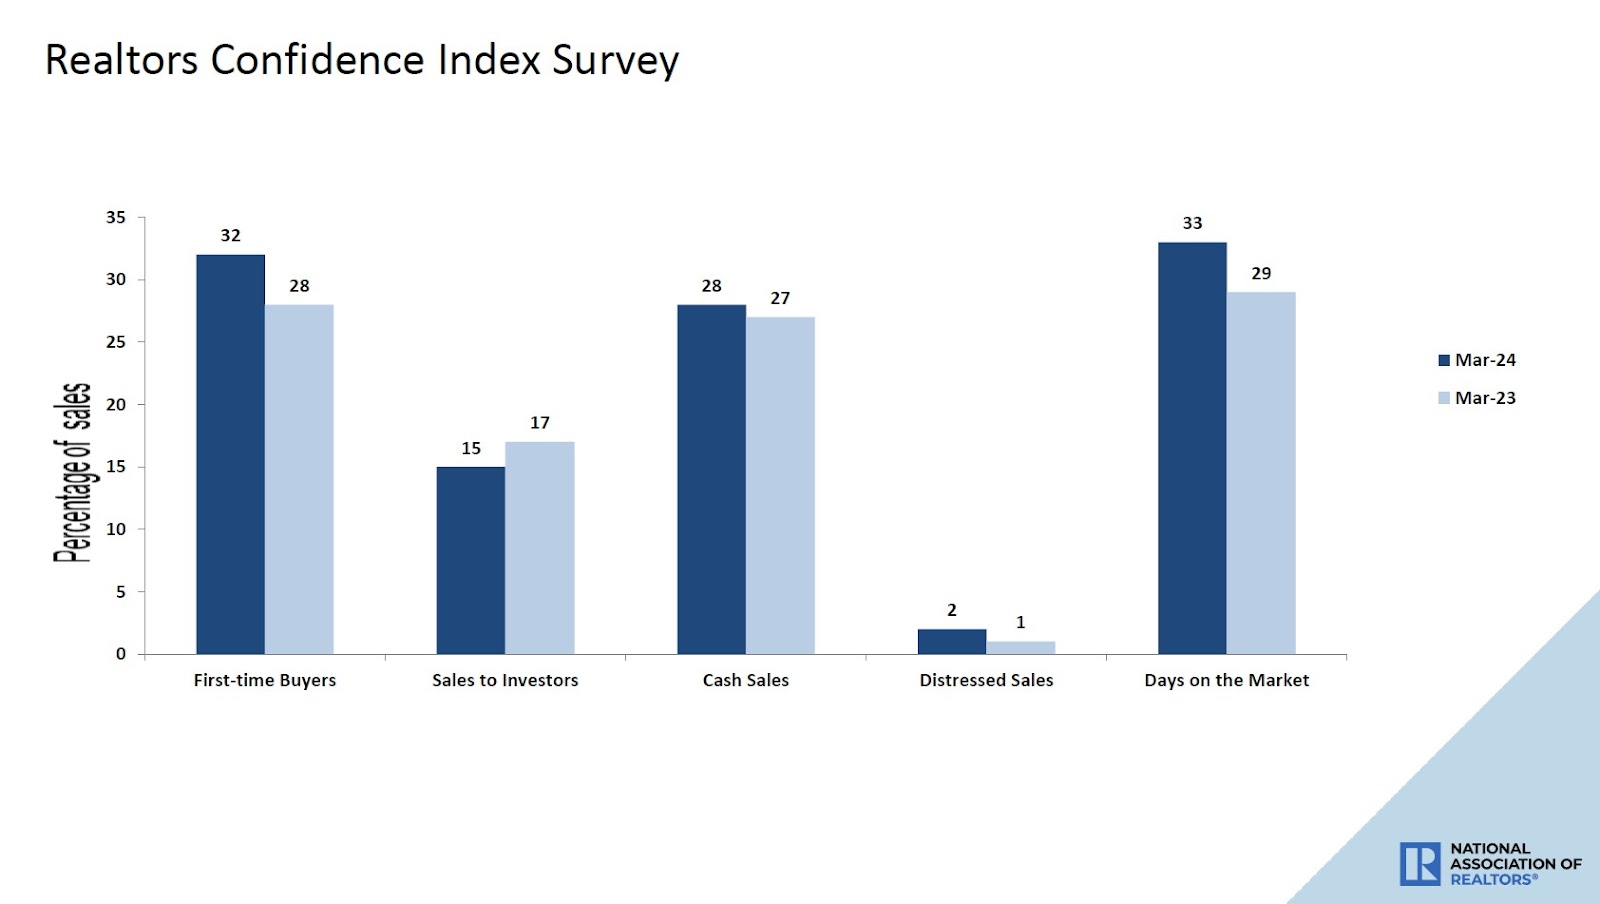
One of the reasons I labeled the housing market savagely unhealthy in 2021 and the early part of 2022 was that the days on the market were at a teenager level. This is never a good thing for housing. This usually means you have a massive credit sales boom that will soon bust. Or, as in this case, it meant we had too many people chasing too few homes. Now that the days on the market are over 30 days, the housing market is healthier.
Just remember, this is a very seasonal data line; it falls in the spring and rises toward the end of the year. I would love to see this level at 30 days year-round — we’ll see if I get this wish.
Overall, the existing homes was a slight beat of my estimates, but roughly in line with what I was expecting after those two big rebound sale prints in previous months. I’m glad to see the inventory growth in the report, but with the tracker, we knew this was coming. If you’re still surprised that home prices continue to rise with higher rates and inventory, I suggest you follow our weekly tracker data, because we are working with the current live weekly data and early in the year the supply and demand equilibrium was still showing price growth.