Projections for mortgage originations are in a downward trend driven by falling refinance volumes as rates rise. Purchase volumes are expected to increase modestly, nowhere near enough to make up the loss from refinance.
For loan officers this all amounts to greater competition to secure borrowers. The contest is not all the same across the country though. Some markets are more concentrated than others at the lender level and could present tougher challenges.
The Home Mortgage Disclosure Act requires lenders to report their activities every year. From this HMDA data, which represents over 7.3 million mortgages originated in 2017, we can evaluate how competitive markets are by looking at their market share distribution.
One way to do this is to use the Herfindahl-Hirschman Index, which uses a formula to calculate how competitive a market is. HHI is a well-respected measure; for example, the U.S. Department of Justice uses it in evaluating mergers for antitrust violations to ensure a merger is not reducing competition to an extent that would harm consumers.
We won’t get into the technical details of the calculation, but it creates a score that ranges from close to zero to 10,000, with a lower number indicating less market concentration and thus greater competition among lenders, which could mean more work for loan officers to find borrowers.
Our data below ranks the top 50 metro areas by HHI, based on the recently released HMDA data for 2017. We also include the market share of the top 10 lenders in the metro area for an alternative measure of market concentration. We show rankings for conventional, FHA and VA loans.
Here’s what we found:
- All metro areas show a healthy level of competition, with the highest HHI at 521 across the three loan types. The Department of Justice considers a market moderately concentrated when the HHI is above 1,500.
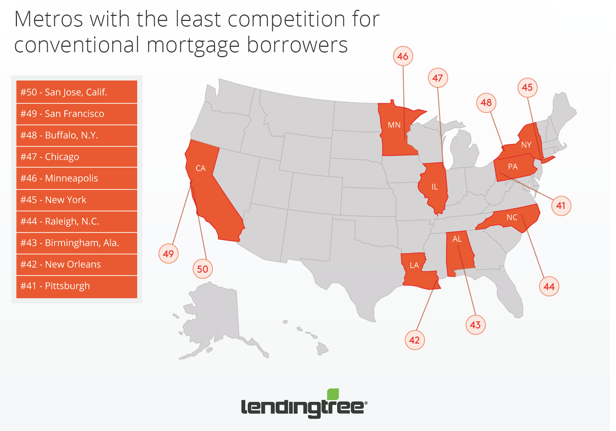
- Some of the more expensive real estate markets have the least competition among lenders for conventional loans. San Jose, San Francisco and New York are all in the bottom 10 of the ranking. Market share for the top 10 lenders is close to or above 50% in these cities.
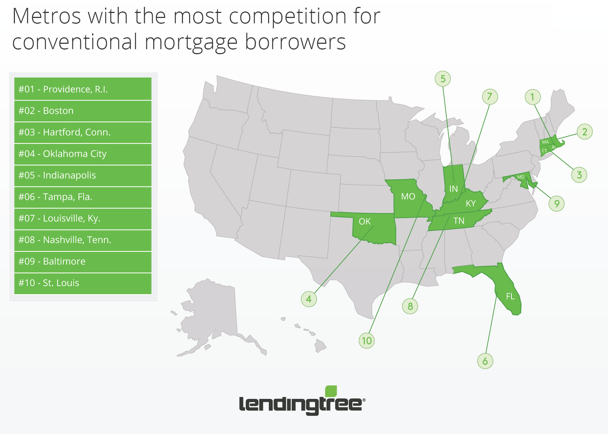
- The most competitive markets were Providence, R.I., Boston and Hartford, Conn., with top 10 market share under 40%.
- Markets that are less competitive for conventional loans are more competitive for FHA loans. San Jose, San Francisco and New York are examples again. This could indicate that lenders are unable to compete in the conventional market concentrate on FHA loans in these cities. Bank lenders are less active in the FHA space leaving it to non-bank lenders and these cities are homes to large money center banks.
- FHA markets are on average more competitive than conventional, but VA markets are less competitive than conventional.
(Video Credit: Alcynna Lloyd)
Metro areas with the most competition for conventional mortgage borrowers:
3. Hartford, Conn.
HHI: 173
Market share of top 10 lenders: 37%
2. Boston
HHI: 171
Market share of top 10 lenders: 35%
1. Providence, R.I.
HHI: 161
Market share of top 10 lenders: 34%
Click to Enlarge
(Source: LendingTree)
Metro areas with the least competition for conventional mortgage borrowers:
48. Buffalo, N.Y.
HHI: 380
Market share of top 10 lenders: 54%
49. San Francisco
HHI: 512
Market share of top 10 lenders: 55%
50. San Jose, Calif.
HHI: 521
Market share of top 10 lenders: 50%
Click to Enlarge
(Source: LendingTree)
Check out where your city falls amid conventional mortgage market concentration, FHA mortgage market concentration and VA mortgage market concentration.