Recent industry reports have cited an approximately $667 per loan increase in total mortgage loan production costs in the fourth quarter of 2015, including all sales, fulfillment, support and corporate expenses. Some media stories have suggested that these increases are directly tied to the Oct. 3, 2015 implementation of the TILA-RESPA Integrated Disclosure rule.
The data is what it is –production costs have increased by $667 per loan. No one is disputing this fact. But how much of this increase is directly attributable to TRID is an open question.
Two-Pronged Impact
At STRATMOR, we’ve been studying this issue very closely and in our view, the reported $667 cost increase had two components. First, there were costs directly associated with implementing the additional origination tasks and processes needed to meet TRID requirements. Secondly, there were unit cost increases that simply resulted from the 13.2% decline in volume in the Q4 2015 versus Q3 numbers (as reported by the MBA).
STRATMOR industry data suggests that fixed production costs – costs that either don’t change (e.g., occupancy and executive costs), or change slowly (e.g., equipment costs) – typically account for between 40% and 50% of total loan production costs. That being the case, of the $7,080 total production expense per loan reported by the MBA in Q3 2015, roughly $3,000 are fixed costs. Therefore, if total unit volume declines by 13.2%, then fixed costs per loan would be expected to increase by 15.2%, or $456 per loan.
This suggests that of the total cost increase of approximately $667 per loan in the fourth quarter, only $211 might reasonably be attributable to the additional tasks and processes implemented by lenders to meet TRID requirements.
As it turns out, this amount is virtually identical to the average $209 TRID cost-per-loan measured or estimated by lenders who participated in STRATMOR’s January 2016 Spotlight Survey: TRID – Impact and Experience.
But the cost impact of TRID is a little more complicated than this. STRATMOR’s MortgageSAT borrower satisfaction program – which gathers information from tens of thousands of individual borrowers on a consistent, rolling, ongoing basis – showed that TRID also caused a 10 to 15-day increase in the average number of days from application-to-closing, beginning in Q4 2015. Even if there were no decline in the actual number of mortgage applications, this kind of increase in timelines would fully explain the 13.2% decline in the volume of closed loans in the fourth quarter.
To put it simply, because of the longer cycle times in the fourth quarter, some loans that would normally have closed during the Q4 2105 were pushed back to Q1 2016. However, and this is important, this “timing effect” on closed loan volume will eventually diminish, if not entirely disappear in future quarters. When it does, the ultimate per loan impact of TRID will remain at the $209 to $211 attributable to added origination tasks and processes (a cost that respondents to the survey expect to decline to about $180 per loan as lenders gain more experience under TRID).
So in a nutshell, yes – Q4 2105 loan production costs did rise, and our analysis suggests that almost all of rise can be attributed to TRID, either directly or indirectly. In large part, though, after the initial front-end impact of longer application-to-fulfillment times dissipates, these costs will moderate and/or disappear in the near future, making the long term financial impact of TRID far less of the nightmare that some reports have made it out to be.
Borrower Satisfaction at All-Time High
While TRID-related loan production costs have risen, it is important to note that, since TRID went into effect, following an initial decline in which borrower satisfaction reached a low of 84.6 in December, borrower satisfaction as measured by MortgageSAT rose sharply from 84.6 in December 2015 to 90.9 by the end of March 2016, an all-time high. This is particularly striking, since it was just these sorts of delays that many in the industry were concerned would negatively impact borrowers the most.
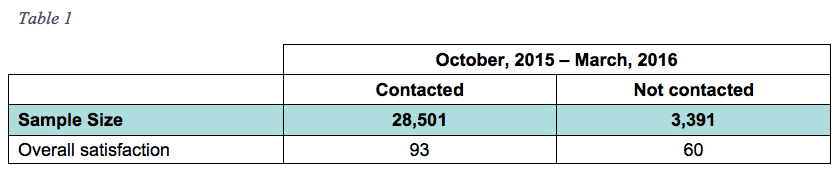
In addition, as seen in Figure 1 below, the increase in satisfaction moved in virtual lockstep with an increase in the share of borrowers who were contacted by their lender prior to closing, which rose from 82% in October 2015 to 87% in March 2016. While cycle times also declined since the start of 2016, it is pretty clear from Table 1 that between Sept and year-end 2015, the 11 day increase in cycle time had no appreciable impact on satisfaction, suggesting that cycle times was not a big factor in borrower satisfaction, a point discussed further below.

To understand why a relatively small improvement in borrower contact has a much larger impact on borrower satisfaction than what might seem to be a more significant change in the time from application to closing, it’s important to understand how each of these two variables affect satisfaction.
For example, consider Table 1 below. The data clearly shows that, over the October 2015 to March 2016 timeframe, borrowers who were contacted by their lender prior to closing had a satisfaction score of 93 versus a score of 60 for those who were not contacted.
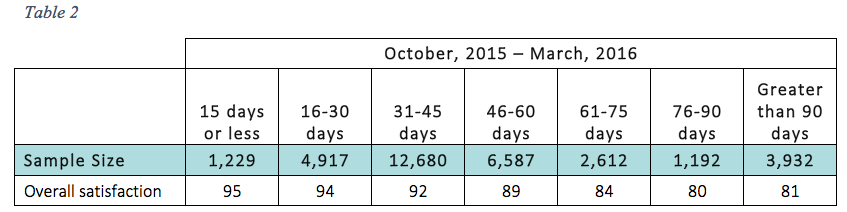
Now consider Table 2 below, which illustrates how borrower satisfaction varies with the time from application-to-closing. Note that borrowers whose loans closed within 31-45 days of application – the typical range – had a satisfaction score of 92, which dropped to only 84 when their loan closed within 61-75 days.
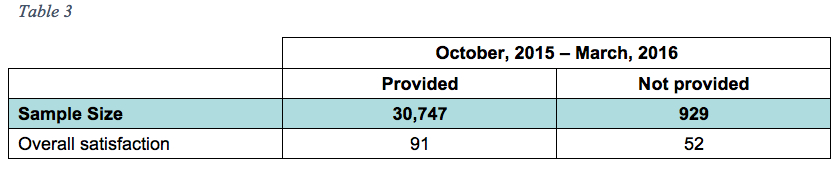
However, up-front communication between the lender and the borrower has had an even more positive impact. For example, borrowers who were provided with an up-front checklist of required documents (see Table 3) had satisfaction scores of 91 versus a score of just 52 for borrowers who were not provided this most basic information.
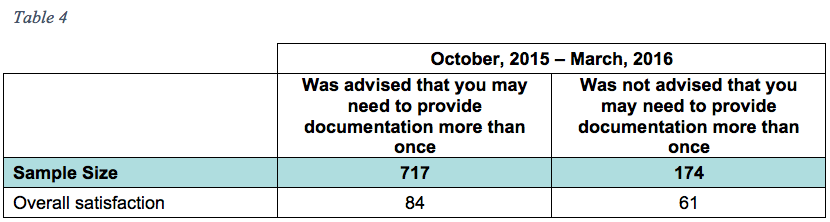
Similarly, Table 4 below shows that simply advising borrowers that they may need to provide more documentation than was initially requested – versus not doing so – also has a large impact on borrower satisfaction, i.e., a score of 84 versus a score of 61.
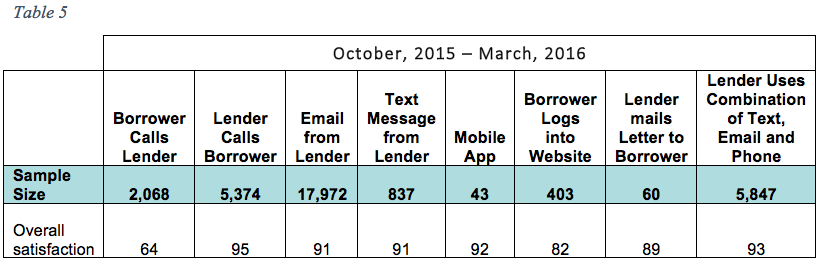
Finally, Table 5 examines the relationship between borrower satisfaction and the method by which a borrower receives ongoing status updates from their lender. Virtually all communication methods used by lenders to proactively keep borrowers updated on their loan status produced satisfaction scores near 90 or higher. On the other hand, where the borrower must take the initiative to communicate with the lender (e.g., the borrower has to call or log-in to a website), satisfaction plummets to as low as 64.
The key takeaway from these findings is that while many lenders equate quality of service with speed to closing, this seems to be much less important to borrowers than proactive lender communications. Borrowers value proactive lender communications throughout the origination process – whether by text messaging, email or simply mailing a letter to the borrower – far more than speed. In fact, as Table 2 shows, speed to close does not have much of an impact at all.
In a slow growth market, where margins are being pressured from many corners (including, but certainly not limited to, TRID-related production costs), borrower satisfaction can be a key differentiator, help drive new business and do a world of good in terms of customer retention. When one considers how much less costly it is to achieve good communication with borrowers versus trying to shave days from the fulfillment process, it becomes clear that lenders would likely be very well served by focusing their attention on borrower communications.