Seasonality plays an important role in the housing market. Home buying and selling activities swell during the spring and summer months of the year, and trail off during the fall and winter.
The concept of seasonality is not well understood or appreciated today.
In this post, we look at the non-seasonally adjusted numbers for existing home sales and mortgage applications to help you understand seasonality in the housing industry. Historically, the ramp up in housing activity early in the year provides important clues about the rest of the year.
We are encouraged by early signs from mortgage applications and existing home sales.
What is the Actual Number of Homes Sold?
Each month, the National Association of Realtors reports existing home sales for the previous month.
“Total existing-home sales, which are completed transactions that include single-family homes, townhomes, condominiums and co-ops, dropped 7.1% to a seasonally adjusted annual rate of 5.08 million in February from 5.47 million in January. “
The seasonally adjusted number is not the actual number of existing homes sold (314,000), but the number of home sales after adjusting for the effect of seasonality.
This procedure makes it easier to compare home sales across different months without seasonality, but it also makes it difficult to see seasonality, which is important for homebuyers, sellers, and housing industry professionals.
Housing Seasonality
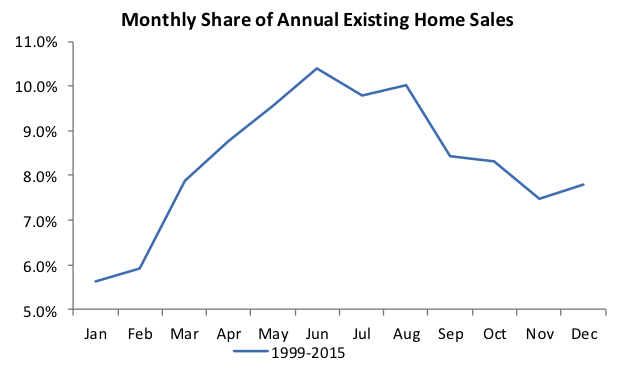
The number of home sales increases significantly as the housing market enters the spring home-selling season. Since 1999, non-seasonally adjusted existing home sales have increased by an average of 33% between February and March.
Throughout the second quarter of the year, existing home sales continue to increase with an average month-over-month growth rate of 10% each month until June. As a result, the four heaviest home-selling months―May, June, July and August―account for 40% of an average year’s total home-selling volume.
Higher volume during the peak selling months is important for both homebuyers and sellers. For home buyers, it means a higher likelihood of finding the right property. For home sellers, it means shorter marketing time and a higher likelihood of finding a buyer.
It is also important for the housing industry, since its full-year results are largely determined by how well it performs during the peak home-selling season.
Home sales begin to contract in earnest in September. Existing home sales fall by an average of 16% from August, and then fall by another 10% in November.
The four lightest months of the year for existing home sales, which is November to February, account for 27% of an average year’s total home-selling volume.
Regional Differences
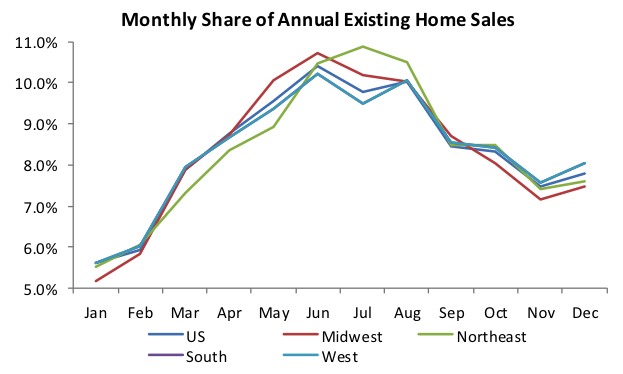
One important use of non-seasonally adjusted housing data is regional comparison, because housing activity’s distribution across the year differs by region.
Both the Northeast and the Midwest have bigger peak home-selling seasons, meaning that more home sales occur during the peak months.
In the Northeast, the home-selling season ramps up more slowly in the spring and lasts only three months instead of four for other regions, meaning that its home sales in June, July and August account for a bigger percentage of annual sales.
The peak home-selling season in the Midwest arrives in May, one month ahead of the rest of the country. But its slowest months, October to February, account for fewer sales than other regions.
These differences are important for homebuyers and sellers to consider when deciding when to enter the market. Housing industry businesses with operations in different regions also need to keep this in mind when comparing month-to-month changes.
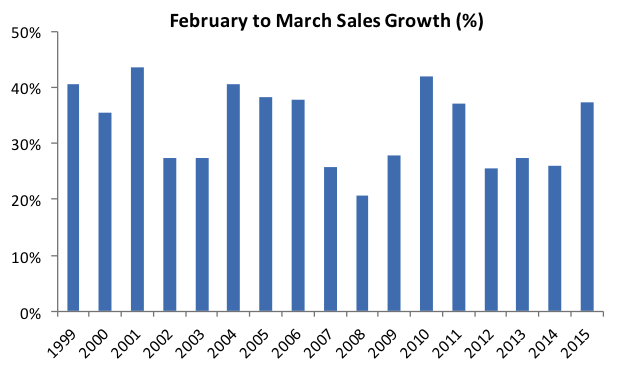
March Increase Weakened Post-Housing Crisis
The spring ramp-up for existing home sales is important for the entire home-selling season as it determines the volume for the home-selling season.
It is therefore not surprising that the March increase has been weaker during the housing downturn. The chart below shows that March sales in six of the past nine years have seen increases of less than 30% vs. just two of the first eight years.
As housing recovers and home sales pick up, we should expect to see stronger growth in March. Existing home sales for March will be released on April 27, and we think early signs from mortgage applications for home purchases are promising.
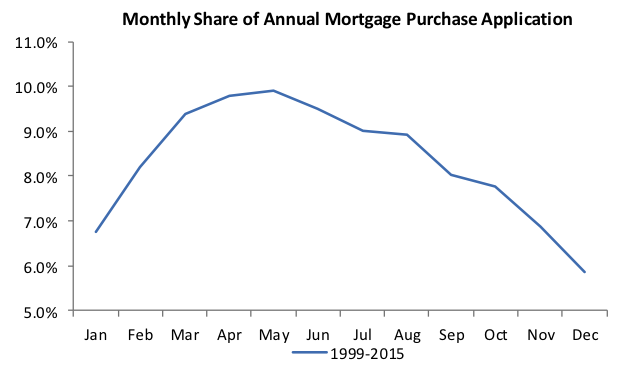
Before homebuyers can close on a purchase, they must first apply for a mortgage. Just like home sales, mortgage applications for home purchases also follow a seasonal pattern.
It typically sees a spike earlier in the year than home sales, in January and February, and also reaches the peak earlier than home sales, in April and May.
This means that mortgage applications are a leading indicator for existing home sales. The largest increase for mortgage applications occurs in February, with month-over-month increases averaging over 20% historically.
This should provide insights into existing home sales volume in March and April. In February 2016, mortgage applications jumped almost 31% from January.
That’s the largest February increase in the last 18 years, which suggests existing home sales are likely to experience significant increases from February and a great start for 2016.