The latest chart in the Mortgage Bankers Association’s series puts existing-home sales into historical context.
According to the most recent report from the National Association of Realtors, total existing-home sales, which are completed transactions that include single-family homes, townhomes, condominiums and co-ops, rose 5.1% to a seasonally adjusted annual rate of 5.35 million in May from an upwardly revised 5.09 million in April.
Click to enlarge
Source: MBA
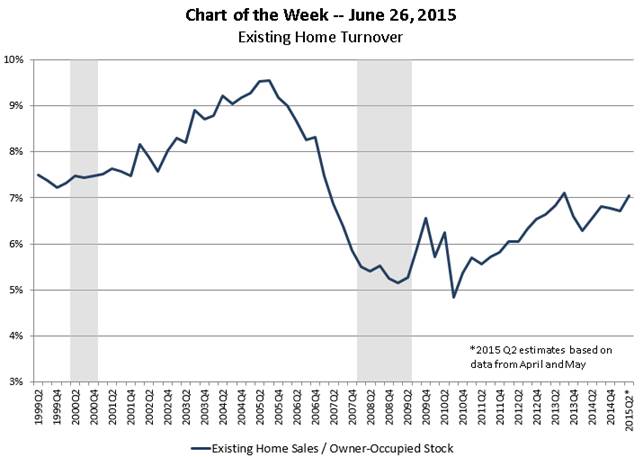
In this week’s chart, the MBA calculated the rate of housing turnover by dividing existing home sales by estimates of the owner-occupied housing stock.
The chart used existing home sales data from April and May to show the turnover rate for the second quarter of 2015. Sales data include single family, cooperative and condominium housing.
But what does it mean?
The MBA explained the chart shows, that while housing markets are recovering, the markets are still weak.
A more “normal” rate is about 7.5%, which is slightly above the current 7%. However, the current rate well-exceeds the recent low of 4.8% from the third quarter of 2010.
“Home sales are being supported by improving labor markets, but mobility remains relatively constrained by the remaining ten percent of households with negative equity, by lingering caution on the part of existing owners who have hesitated to become move-up buyers, and by still tight credit conditions,” the MBA stated in its report.