
Existing home sales had a huge beat of estimates on Tuesday. This wasn’t shocking for people who follow how I track housing data. To understand why we had such a beat in sales, you only need to go back to Nov. 9, when mortgage rates started to fall from 7.37% to 5.99%.
During November, December and January, purchase application data trended positive, meaning we had many weeks of better-looking data. The weekly growth in purchase application data during those months stabilized housing sales to a historically low level.
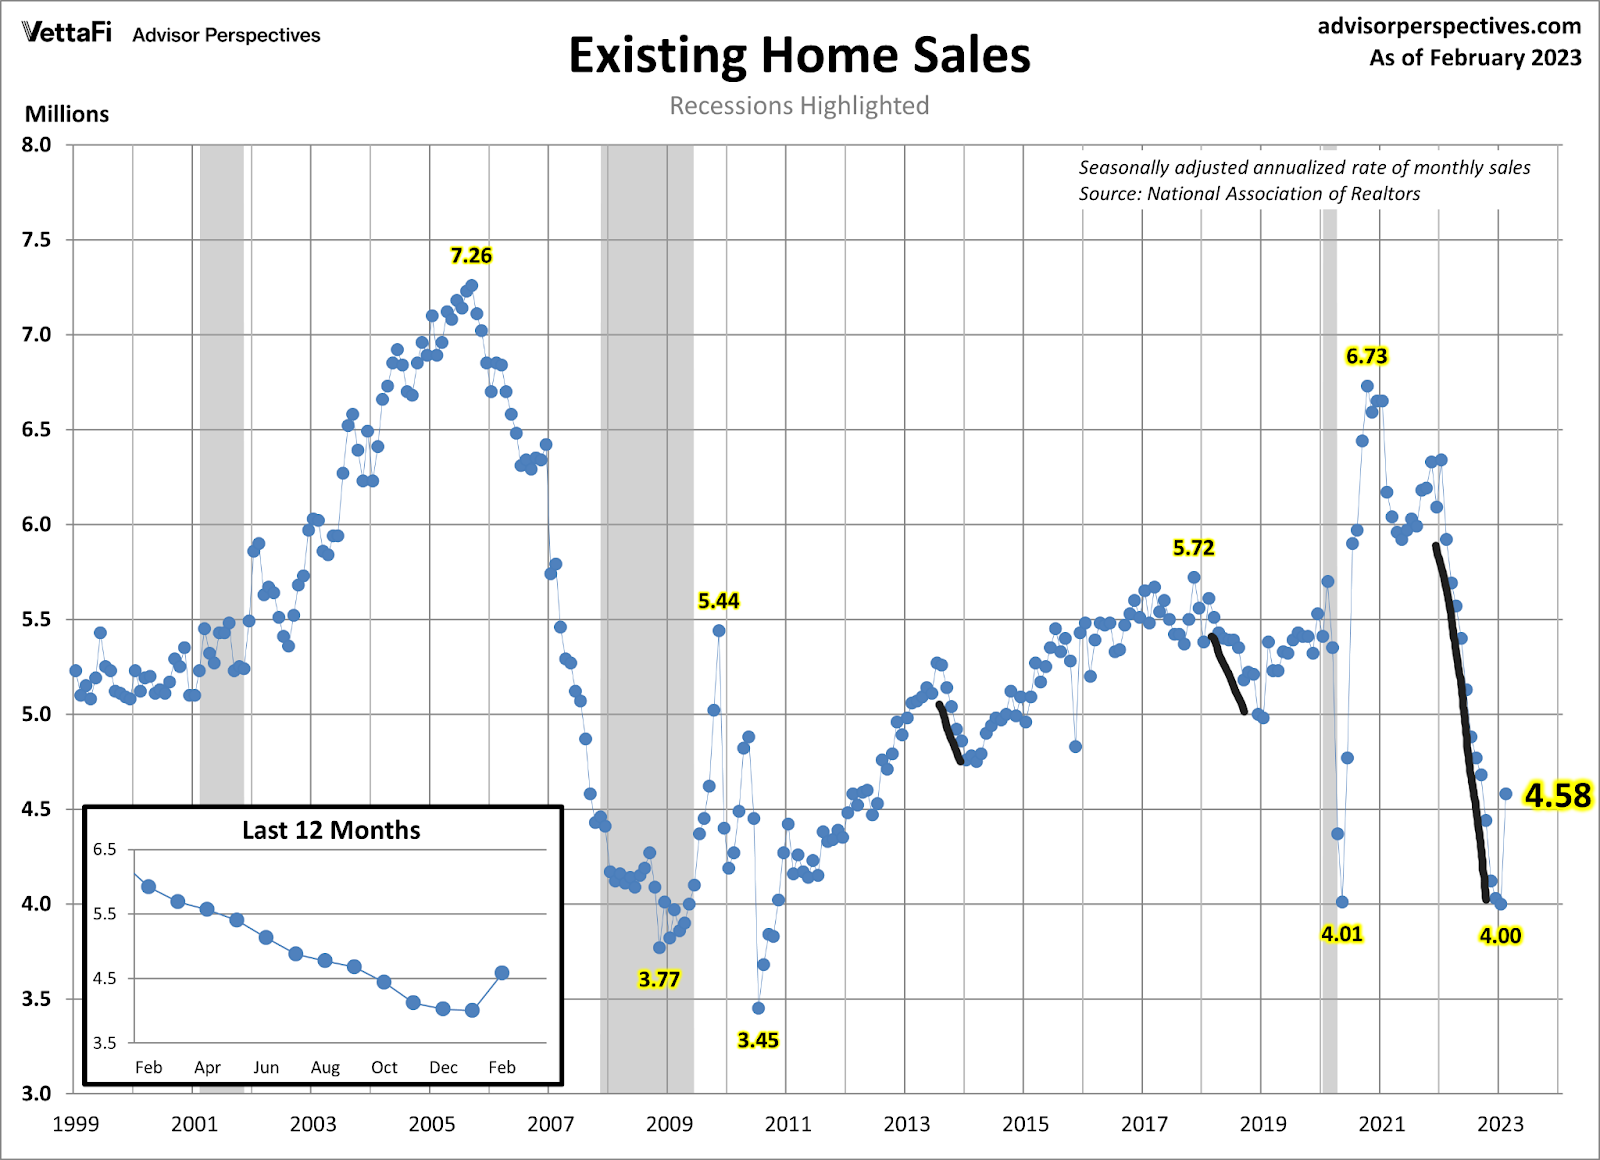
For many years I have talked about how rare it is that existing home sales trend below 4 million. That is why the historic collapse in demand in 2022 was one for the record books. We understood why sales collapsed during COVID-19. However, that was primarily due to behavior changes, which meant sales were poised to return higher once behavior returned to normal.
In 2022, it was all about affordability as mortgage rates had a historical rise. Many people just didn’t want to sell their homes and move with a much higher total cost for housing, while first-time homebuyers had to deal with affordability issues.
Even though mortgage rates were falling in November and December, positive purchase application data takes 30-90 days to hit the sales data. So, as sales collapsed from 6.5 million to 4 million in the monthly sales data, it set a low bar for sales to grow. This is something I talked about yesterday on CNBC, to take this home sale in context to what happened before it.
Because housing data and all economics are so violent lately, we created the weekly Housing Market Tracker, which is designed to look forward, not backward.
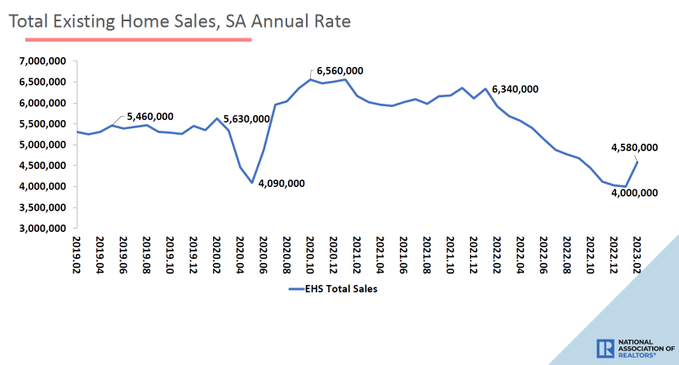
From NAR: Total existing-home sales – completed transactions that include single-family homes, townhomes, condominiums and co-ops – vaulted 14.5% from January to a seasonally adjusted annual rate of 4.58 million in February. Year-over-year, sales fell 22.6% (down from 5.92 million in February 2022).
As we can see in the chart above, the bounce is very noticeable, but this is different than the COVID-19 lows and massive rebound in sales. Mortgage rates spiked from 5.99% to 7.10% this year, and that produced one month of negative forward-looking purchase application data, which takes about 30-90 days to hit the sales data.
So this report is too old and slow, but if you follow the tracker, you’re not slow. This is the wild housing action I have talked about for some time and why the Housing Market Tracker becomes helpful in understanding this data.
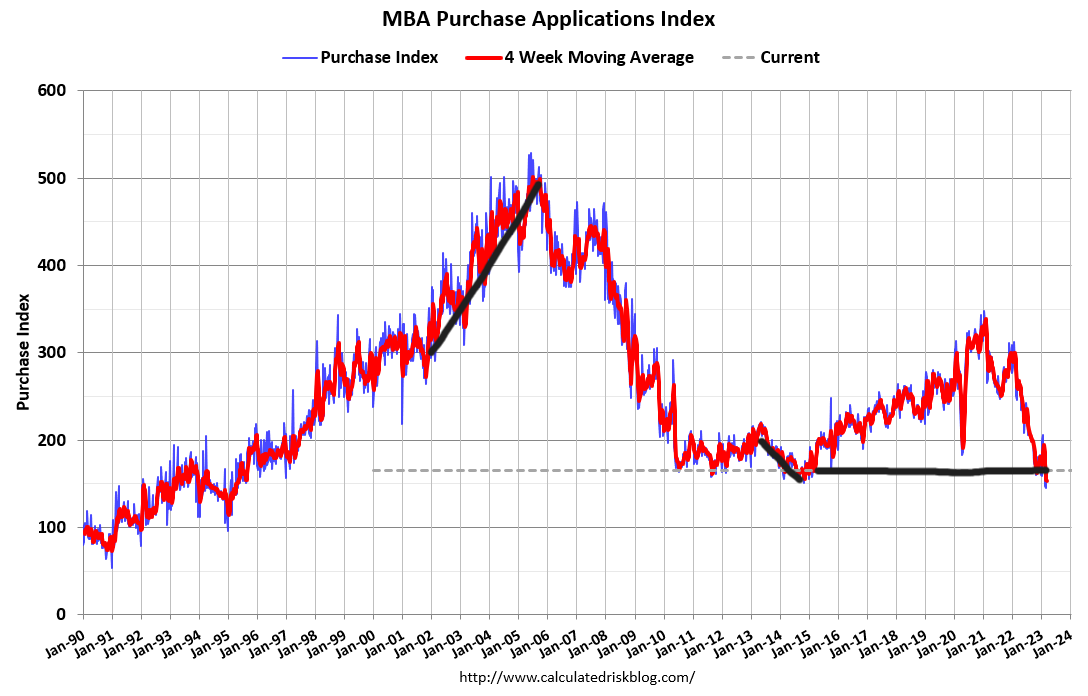
The last two weeks have had positive purchase application data as mortgage rates fell from 7.10% down to 6.55%; tomorrow, we will see if we can make a third positive week. One thing to remember about purchase application data since Nov. 9, 2022 is that it’s had a lot more positive data than harmful data.
However, the one-month decline in purchase application data did bring us back to levels last seen in 1995 recently. So, the bar is so low we can trip over.
One of the reasons I took off the savagely unhealthy housing market label was that the days on the market are now above 30 days. I am not endorsing, nor will I ever, a housing market that has days on the market at teenager levels. A teenager level means one of two bad things are happening:
1. We have a massive credit boom in housing which will blow up in time because demand is booming, similar to the run-up in the housing bubble years.
2. We simply don’t have enough products for homebuyers, creating forced bidding in a low-inventory environment.
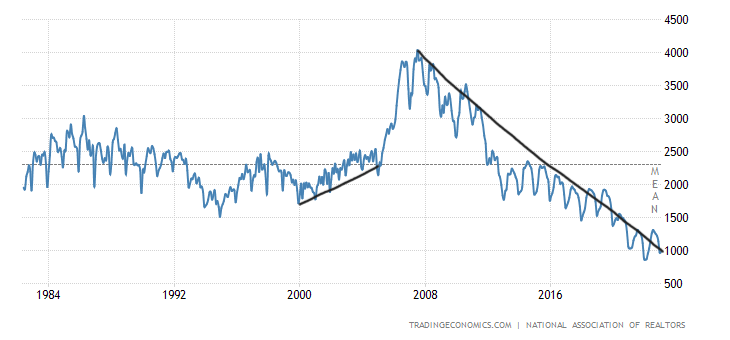
Guess which one we had post 2020? Look at the purchase application data above — we never had a credit boom. Look at the Inventory data below. Even with the collapse in home sales and the first real rebound, total active listings are still below 1 million.
From NAR: Total housing inventory registered at the end of February was 980,000 units, identical to January & up 15.3% from one year ago (850,000). Unsold inventory sits at a 2.6-month supply at the current sales pace, down 10.3% from January but up from 1.7 months in February ’22. #NAREHS
However, with that said, the one data line that I love, love, love, the days on the market, is over 30 days again, and no longer a teenager like last year, when the housing market was savagely unhealthy.
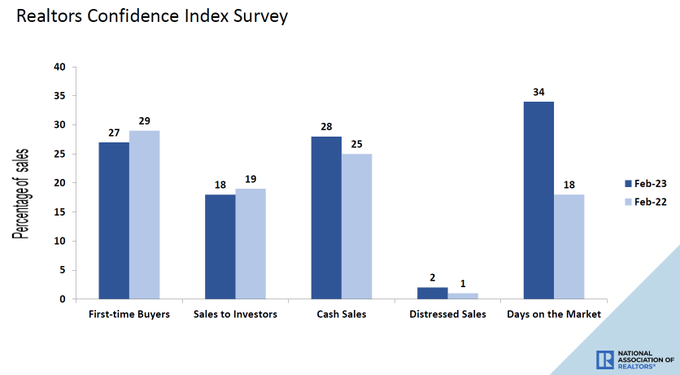
From NAR: First-time buyers were responsible for 27% of sales in January; Individual investors purchased 18% of homes; All-cash sales accounted for 28% of transactions; Distressed sales represented 2% of sales; Properties typically remained on the market for 34 days.
Today’s existing home sales report was good: we saw a bounce in sales, as to be expected, and the days on the market are still over 30 days. When the Federal Reserve talks about a housing reset, they’re saying they did not like the bidding wars they saw last year, so the fact that price growth looks nothing like it was a year ago is a good thing.
Also, the days on market are on a level they might feel more comfortable in. And, in this report, we saw no signs of forced selling. I’ve always believed we would never see the forced selling we saw from 2005-2008, which was the worst part of the housing bubble crash years. The Federal Reserve also believes this to be the case because of the better credit standards we have in place since 2010.
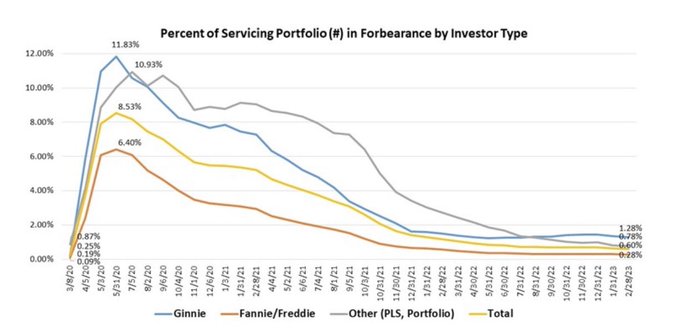
Case in point, the MBA‘s recent forbearance data shows that instead of forbearance skyrocketing higher, it’s collapsed. Remember, if you see a forbearance crash bro, hug them, they need it.
Today’s existing home sales report is backward looking as purchase application data did take a hit this year when mortgage rates spiked up to 7.10%. We all can agree now that even with a massive collapse in sales, the inventory data didn’t explode higher like many have predicted for over a decade now.
I have stressed that to understand the housing market, you need to understand how credit channels work post-2010. The 2005 bankruptcy reform laws and 2010 QM laws changed the landscape for housing economics in a way that even today I don’t believe people understand.
However, the housing market took its biggest shot ever in terms of affordability in 2022 and so far in 2023, and the American homeowner didn’t panic once. Even though this data is old, it shows the solid footing homeowners in America have, and how badly wrong the extremely bearish people in this country were about the state of the financial condition of the American homeowner.
