

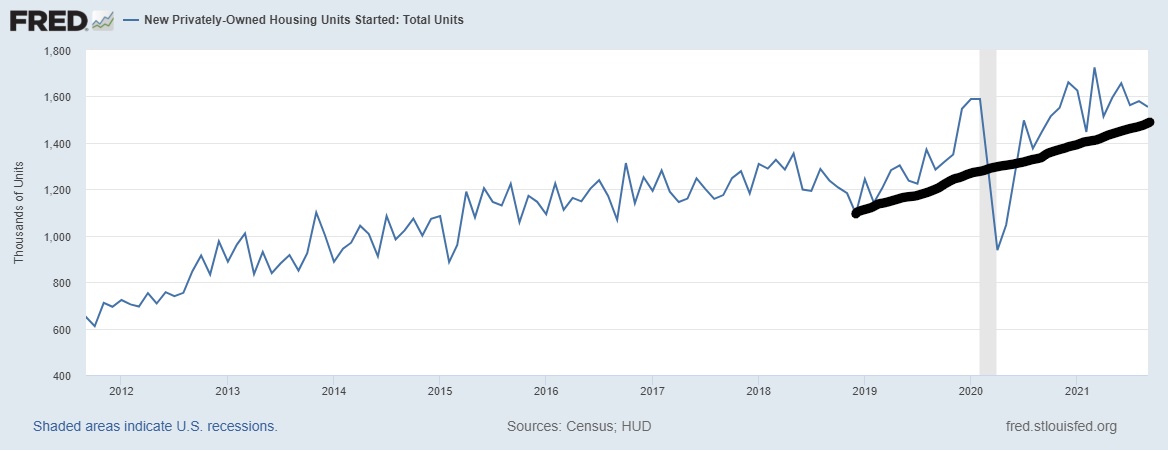
Today, the U.S. Census Bureau reported that housing starts hit 1.55 million for September, and housing permits came in at 1.589 million. These data lines missed monthly expectations, and we had negative revisions to the previous months when combined — overall, not the most exciting report. However, one thing to always remember with housing starts data is that the month-to-month data can be extreme but the long-term trend does tell the real story of what is going on.
What that story is telling us is that we have enough demand to keep building homes in America.
On permits, the Census reports: Privately‐owned housing units authorized by building permits in September were at a seasonally adjusted annual rate of 1,589,000. This is 7.7 percent (±0.9 percent) below the revised August rate of 1,721,000, but is virtually unchanged from (±1.1 percent)* the September 2020 rate of 1,589,000. Single‐family authorizations in September were at a rate of 1,041,000; this is 0.9 percent (±0.8 percent) below the revised August figure of 1,050,000. Authorizations of units in buildings with five units or more were at a rate of 498,000 in September.
On housing starts, Census reports: Privately‐owned housing starts in September were at a seasonally adjusted annual rate of 1,555,000. This is 1.6 percent (±11.4 percent)* below the revised August estimate of 1,580,000, but is 7.4 percent (±13.0 percent)* above the September 2020 rate of 1,448,000. Single‐family housing starts in September were at a rate of 1,080,000; this is virtually unchanged from (±8.4 percent)* the revised August figure of 1,080,000. The September rate for units in buildings with five units or more was 467,000.
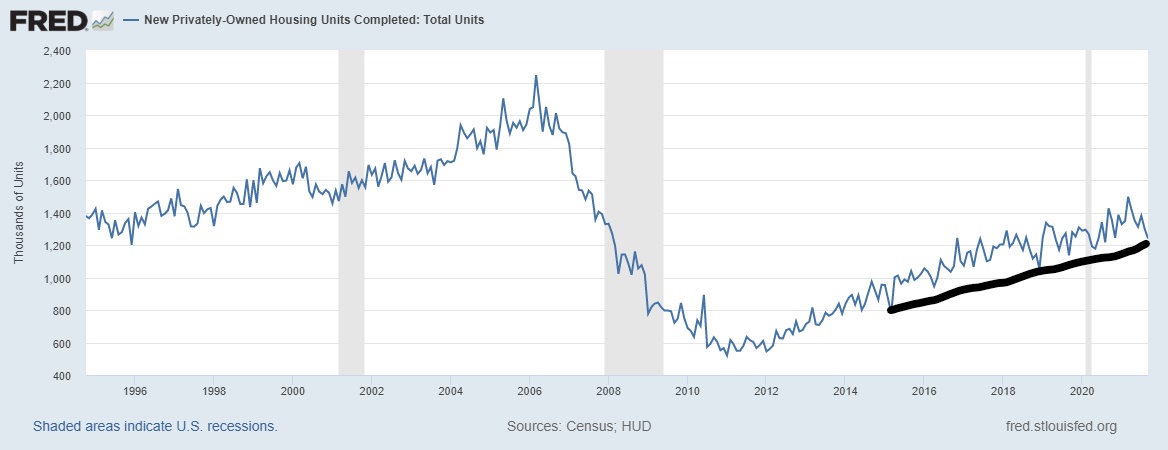
On housing completion, Census reports: Privately‐owned housing completions in September were at a seasonally adjusted annual rate of 1,240,000. This is 4.6 percent (±9.0 percent)* below the revised August estimate of 1,300,000 and is 13.0 percent (±9.1 percent) below the September 2020 rate of 1,426,000. Single‐family housing completions in September were at a rate of 953,000; this is virtually unchanged from (±11.7 percent)* the revised August rate of 953,000. The September rate for units in buildings with five units or more was 280,000.
I know people will say that labor and material constraints are holding back housing starts from growing more. However, the 2021 housing starts data — which have hit pre-cycle highs — looks right to me considering how new home sales and the monthly supply data looks currently. As long as you look at this in a slow and steady manner then it will make sense.
If you’re looking for a construction boom or a sales boom, then the data might look off to you. One thing to remember about two-unit housing starts where the growth is 38% year over year, is that the comps were low last year because the rental sector was showing some weakness. In general, all housing data should show negative year-over-year data as the comps will be too high due to the surge in make-up demand we saw toward the end of 2020 due to the COVID-19 delays.
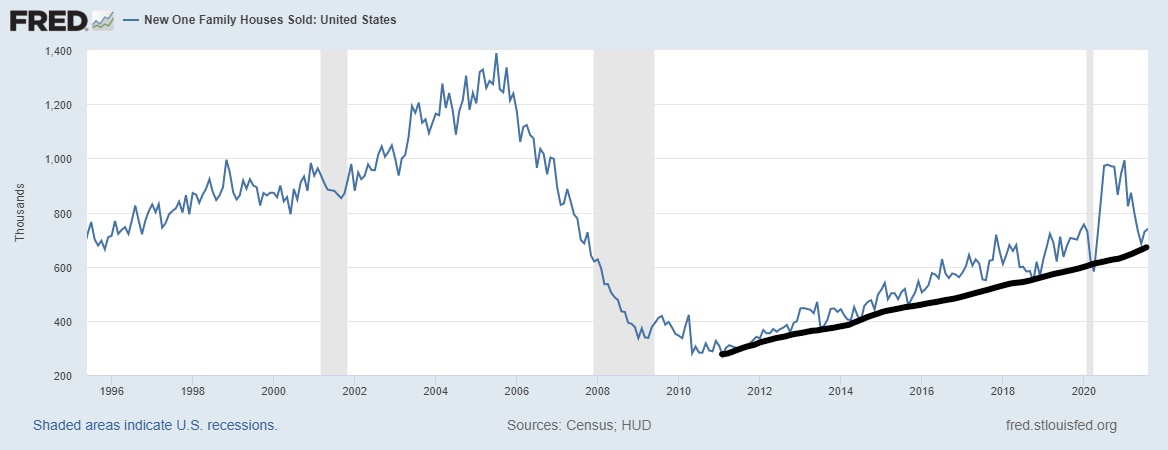
New home sales are coming up next week. However, slow and steady action here is the name of this dance, not a hot rocking PitBull concert. Rising rates always impact this sector the most. However, the mortgage rate I am looking for has been the same since the summer of 2020: 3.75% and higher. However, to get to 3.75% and higher, you need the 10-year yield to break over 1.94%, something that wasn’t part of my 2021 forecast.

From me always, the new home sales and housing starts sector revolves around how the monthly supply data looks. The last two new home sales reports had positive revisions, which stopped the increase in monthly supply data from rising. More on that here.
The rule of thumb for me is that housing gets a red flag once the monthly supply levels get above 6.5 months on a three-month average. The last report shows the supply data to be 6.1 months. When we are between 4.4 -6.4 months it’s just an OK marketplace and that is how I view the new home sales and housing start market currently.
Once monthly housing supply can break under 4.3 months, the homebuilders are extremely happy campers no matter what they’re complaining about. I give these monthly supply levels to try to create a more calm process for how to look at housing data. This sector of the economy gets trolled out by some of the craziest internet trolling groups ever. You know who I am talking about: the housing bubble boys and the forbearance crash bros.
Remember, economics done right should be boring, and you should always be the detective, not the troll.
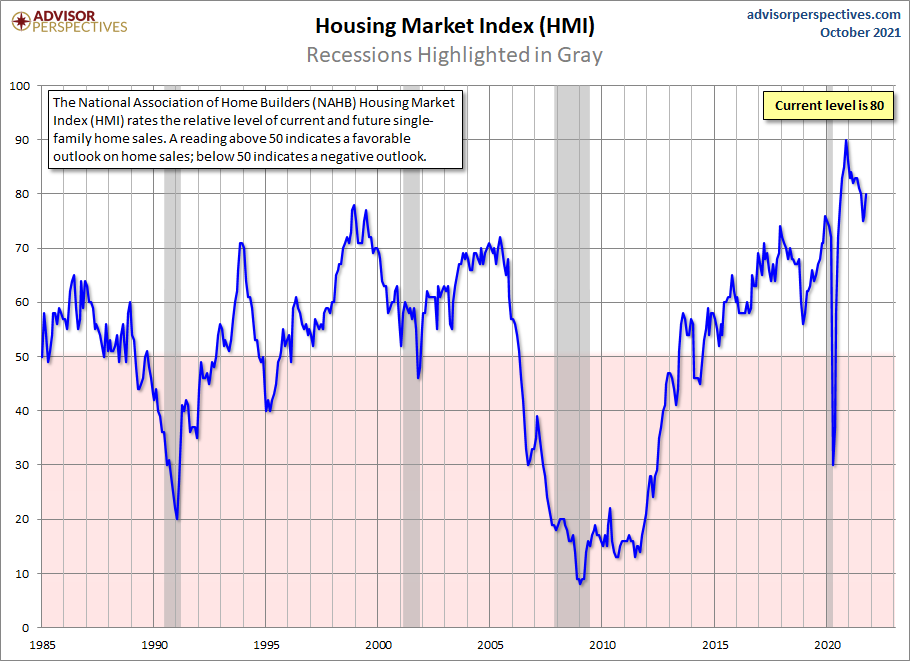
This starts report came in less than expected even with the builder confidence data picking up noticeably in yesterday’s report. A lot of this rebound in the builder’s confidence I believe was due to the last two new home sales reports confirming and stabilizing the monthly supply data. Even though this data is historically high, I would have you focus on the rate of change of this data line now that the moderation from the COVID-19 surge in a few housing data lines levels has been completed.
Last week, Ivy Zelman created a stir when she went on CNBC and talked about housing being overbuilt by 20%. I didn’t find the comments too crazy once you actually broke down what she said and what she didn’t say. My take on it is here.
Home prices for new and existing homes did show some heat for sure in 2020 and 2021.

The sales and housing start data are showing us a more intimate slow dance, which can be appreciated by those looking for a long-lasting relationship with housing construction and not a boom and bust fling as we saw from 2002-2008.
