Can we now say that the housing market‘s spring selling season is finally underway? Since 2020, the seasonal bottom for housing inventory has arrived several months later than normal, making it more complicated to track housing inventory data. Still, we have some promising signs that we might have finally hit the inventory bottom for 2023.
We didn’t see too much volatility in mortgage rates last week, but purchase apps declined in reaction to rates rising two weeks ago.
Here’s a quick rundown of the last week:
- Active listings rose by 8,546, and new listing data showed some growth.
- Purchase application data was down 10%, keeping the tradition of higher rates impacting this weekly date negatively intact.
- Mortgage rates started the week off at 6.61% and ended at 6.66%, so a calm week on the rate front.
Weekly housing inventory
Looking at the Altos Research data from two weeks ago, the first thing that popped to my mind when active listings fell and new listing data fell was that we could have had an Easter Holiday impact at that time. If that is the case, then this week’s gain in active inventory and new listings needs to be taken with a grain of salt until we get next week’s data.
My bias is wanting to see active and new listings data grow, so I have to check myself when I see positive housing inventory data that might need more confirmation.
Since 2020, the seasonal inventory bump has happened later than usual — not until March or April. I went over the reasons for this in the Housing Wire Daily podcast in February. In addition to the fact that housing inventory since 2020 has been working at all-time lows, purchase application data growth late in the year has pushed out the seasonal bottom for the following year.
I hope the seasonal bottom was two weeks ago. It’s springtime and we have always had a traditional spring increase in housing inventory — it would not be a healthy sign if we didn’t get active listings to grow now.
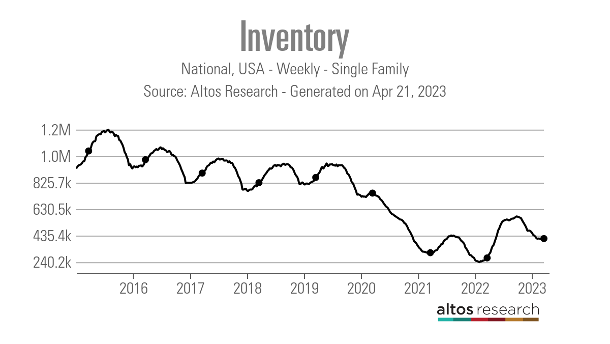
- Weekly inventory change (April 14-21): Inventory rose from 405,468 to 414,010
- Same week last year (April 15-April 22): Inventory rose from 267,459 to 271,510
- The bottom for 2022 was 240,194
- The peak for 2023 so far is 472,680
- For context, active listings for this week in 2015: 1,059,330
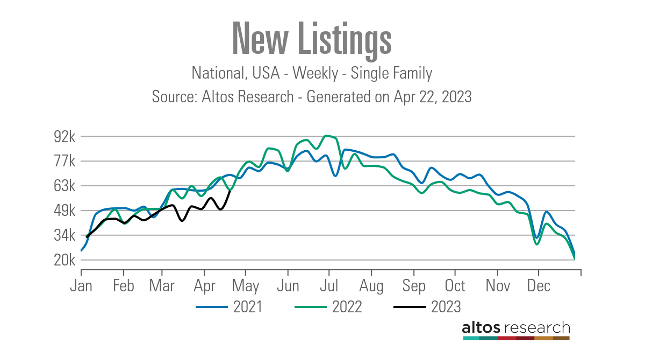
New listing data hasn’t recovered since last year’s big mortgage rate spike, and we have been trending at all-time lows in 2023. However, for this week, we saw good week-to-week growth and the new listing data for this calendar week isn’t too far off from what we saw in 2022. Again, I am a bit mindful here due to Easter. However, I will take what I can now.
New listings:
- 2021: 69,025
- 2022: 60,351
- 2023: 59,926
For some historical perspective, back when housing inventory levels were normal, here are the weekly new listing numbers for 2015-2017:
- 2015: 88,972
- 2016: 95,131
- 2017: 77,570
As you can see in the chart below, new listing data is highly seasonal, so we don’t have much time left before the seasonal decline in the data line.
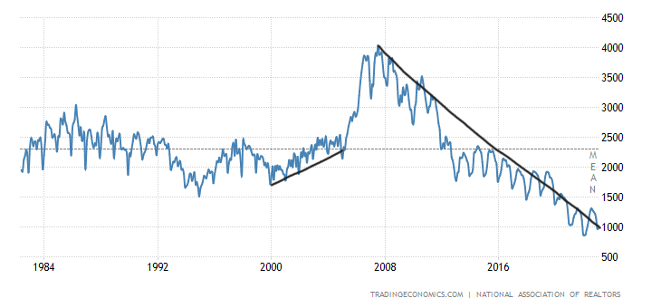
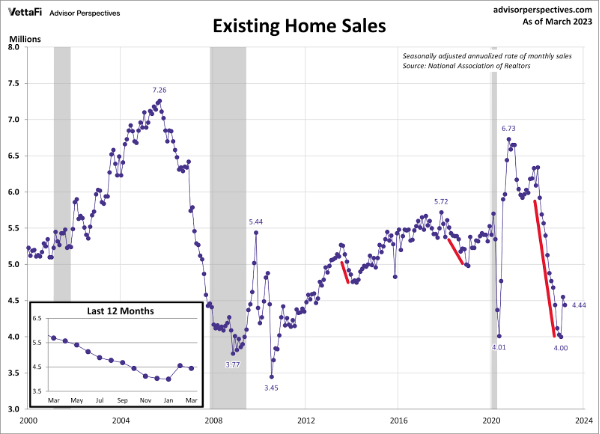
The NAR data going back decades shows how difficult it’s been to get back to anything normal on the active listing side post-2020. In 2007, when sales were down big, total active listings peaked at over 4 million. Back then we had high inventory levels while the unemployment rate was still excellent. It shows what a massive credit bubble we were in back then, but none of that action has been happening for years.
Even though today sales are trending at 2007 levels, we are only at 980,000 total active listings per the last existing home sales report.
People often ask me why there is such a difference between the NAR data versus the Altos Research inventory data. This link explains the difference and is worth a read.
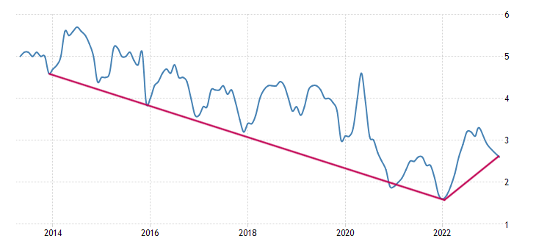
On the monthly supply for existing homes, I know stock traders and YouTube people are notorious for comparing everything to housing in 2008. Below is the monthly supply of existing homes from 1999-2014, where you can clearly see the growth in monthly supply from 2006-2011. The red line is where NAR believes a balanced market is, at six months of supply. I believe that number is four months. Either way, today the monthly supply of 2.6 months shows how far we are from 2008 housing economics.
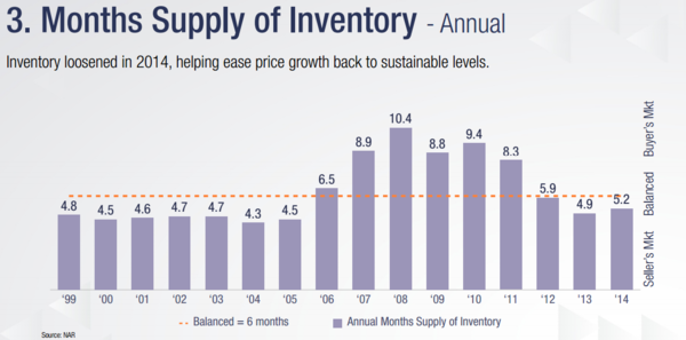
Contrast the chart above — which is NAR monthly supply data from 1999-2014 — with the chart below, which is NAR monthly supply data from 2013-2023. As you can in the chart below, the monthly supply data shows we have no forced selling action in the housing market today, unlike the 2006-2011 period.
The 10-year yield and mortgage rates
Last week, mortgage rates didn’t move much, even though the jobless claims data is getting softer. Despite the chief economist at The Conference Board stating on CNBC last week that they believe the recession has already started, we didn’t see too much action on the 10-year yield and rates. I presented my six recession red flags model to The Conference Board last year. A lot of my focus on where bond yields and mortgage rates can go is based on where the labor market is heading, so, The Conference Board stating we are starting a recession now is a big deal.
In my 2023 forecast, I said that if the economy stays firm, the 10-year yield range should be between 3.21% and 4.25%, equating to 5.75% to 7.25% mortgage rates. If the economy gets weaker and we see a noticeable rise in jobless claims, the 10-year yield should go as low as 2.73%, translating to 5.25% mortgage rates.
As you can see in the chart below, we have stayed in the firm economic 10-year yield range 100% of the time. We can also see how hard it’s been for the 10-year yield to break below the 3.37%-3.42% area with any conviction.
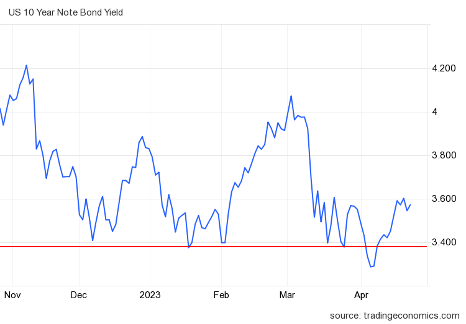
The labor market, while getting somewhat softer recently, hasn’t broken this year yet, so even with all the drama we’ve seen in 2023, the bond market has held within its proper channel, meaning mortgage rates should stay in the range between 5.75%-7.25%.
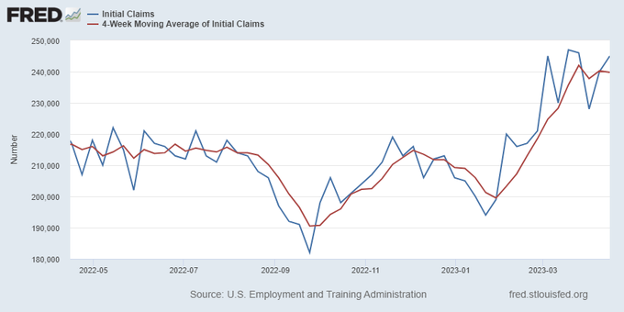
I am watching jobless claims because the Fed will pivot its language on the economy once jobless claims get above 323,000 on the four-week moving average. However, we are still far from those levels, even though it has risen recently. Last week initial jobless claims increased by 11,000, and the four-week moving average rose to 239,750.
Purchase application data
Purchase application data has been a bright spot as far as housing market data. In 2022, home sales collapsed in a waterfall fashion. However, starting on Nov. 9, 2022, purchase application data began to improve and that improvement has created stabilization in the sales data in 2023.
Since Nov. 9, excluding some holiday weeks, we have had 15 positive and six negative purchase application prints. This year, we have had eight positive prints versus six negative prints. This index is very rate-sensitive. For the most part, when mortgage rates have risen this year, we have seen this index fall week to week, and that is what we saw last week as the index was down 10% week to week and down 36% year over year.
As the chart below shows, we have a shallow bar in this data line since the crash in 2022.
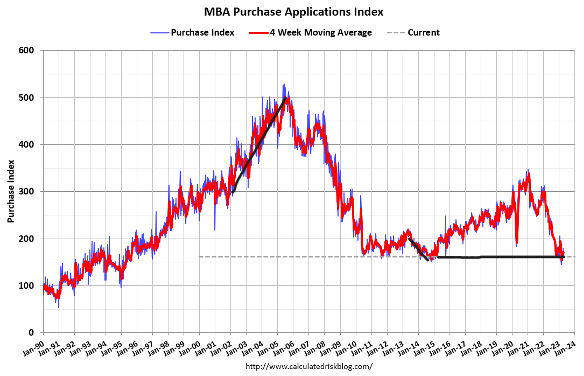
As I have often stressed when I talk about this data line, don’t think of this as the V-shaped recovery we saw during COVID-19, but just stabilization and growth from a low bar. Every year I usually weigh this index from the second week of January to the first week of May — traditionally, after May, volumes always fall.
Now, if the economy gets weaker later in the year and mortgage rates fall at that time, we all need to focus more on purchase application data. The last few years have seen positive purchase application numbers in fall and winter and we can make a case for that happening again if mortgage rates break below 6% this year.
The week ahead: Four housing reports to chew on
On Tuesday, we have the new home sales report, the lagging S&P CoreLogic Case-Shiller home price report, and the FHFA home price index. Of course, we all know the month-to-month pricing data has firmed up as the housing economic story of the second half of 2022 has changed this year. Keep things simple: demand has stabilized and active listings are still historically low.
For the builders, their stocks have been on fire, which has driven some short stock traders mad! However, I want to see what their active monthly supply data looks like now; the key for me is getting monthly supply below 6.5 months. While housing completions are still rising, which is good, we haven’t had growth in housing permits, which is key in getting housing out of the recession.
We also have the pending home sales report on Thursday, which has already had a big bounce from the lows. It gets harder to keep the bounce going if purchase apps don’t show more growth. We also have to remember almost 30% of homes are still bought with cash, so housing demand doesn’t need to be 100% driven by mortgage buyers.
As always, I will keep a close eye on jobless claims and each day can bring out some crazy news that can move the bond market. In time, as we get closer and closer to the debt ceiling, we will address the market concerns and what it could mean for the economy.