The housing market has been wild the last few years, making weekly data more critical. This is why I’ve created the Housing Market Tracker — a weekly analysis of purchase apps, housing inventory and mortgage rates that will be published every Monday.
I want to focus on these three data lines because they will give us a glimpse into the future, so we don’t have to wait for the existing home sales data, which can be old if the market turns. In a normal market, we wouldn’t need to be concerned about weekly data so much, but we aren’t living in normal times.
Last year was the most chaotic housing year I’ve ever seen: market dynamics changed three different times and mortgage rates had a historic move from 3.27% to a high of 7.37%. Then those rates fell 1.25%, which changed the demand data, only to rise again in a short timeframe.
Looking at these three data lines is important because:
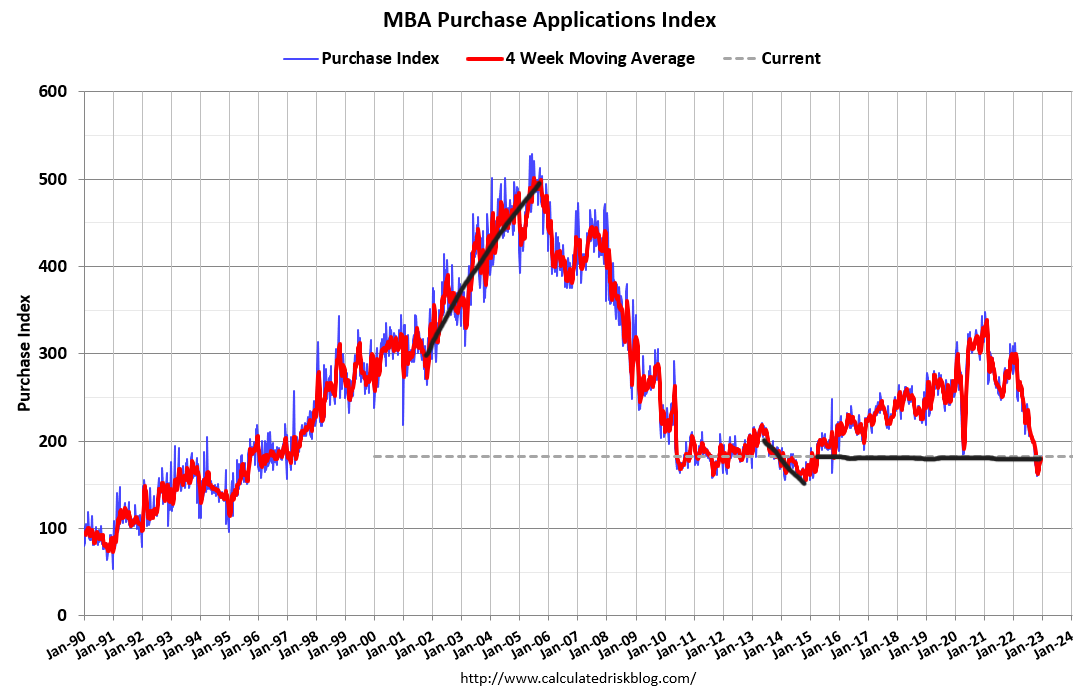
Purchase application data is a demand trend that looks out 30-90 days. This data had a historic year in 2022, with a waterfall collapse that wiped out eight years of the index in one year. This trend survey index has been the core of the housing economy for a decade and is a tricky data line sometimes if you don’t make some adjustments.
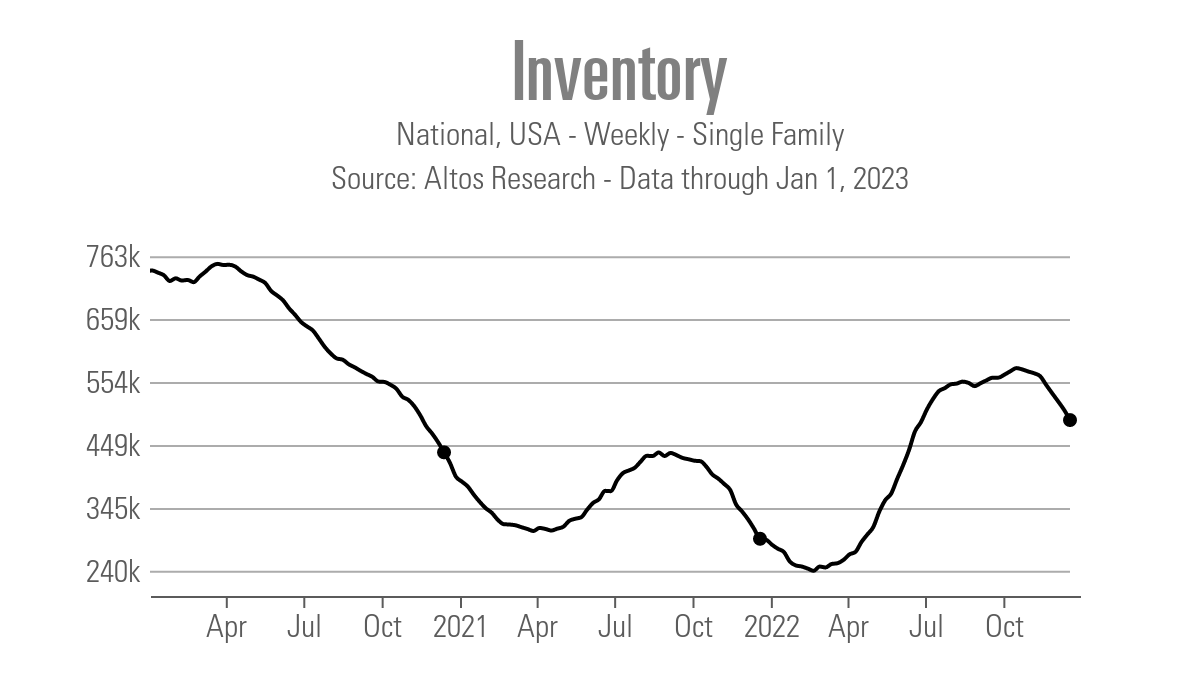
The Altos Research weekly inventory data looks ahead before the sales report inventory data. This can give us a heads-up on how much the forward-looking demand impacts the inventory channels before the sales report comes in.
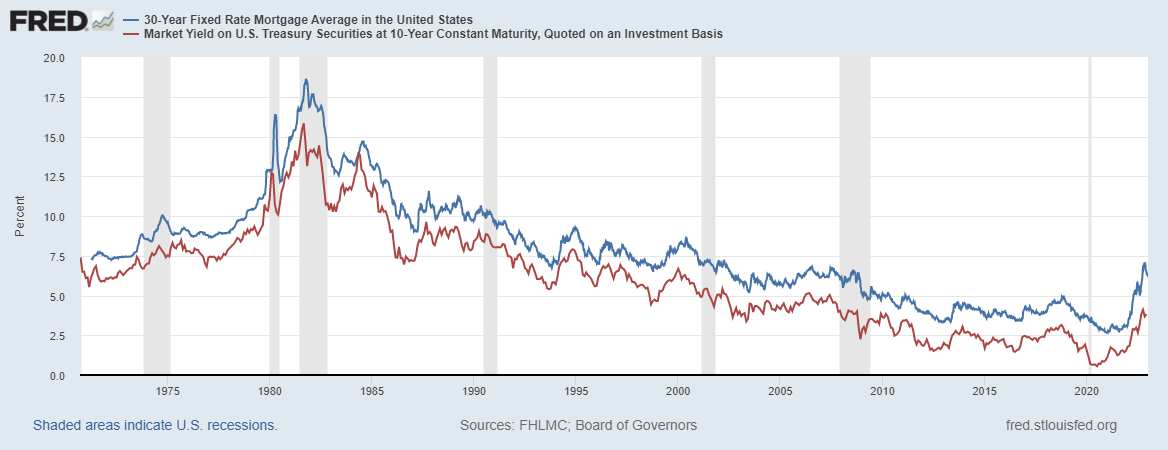
The 10-year yield shows where mortgage rates will go. Since 2015, when I started to forecast mortgage rates in my prediction articles, I always start talking about where I believe the 10-year yield is going that year. You can see below the relationship between the 10-year yield and mortgage rates has been solid since 1971.
For this weekly tracker, I’ll talk about the weekly bond market moves and what can drive mortgage rates in the upcoming week, and what the previous week in mortgage rates did to the other data lines we are tracking weekly.
Purchase application data
We didn’t have a purchase application report last week, as we will get an updated report on Wednesday for the past two weeks. We had some exciting data after the weaker CPI report in November. For a couple of months, purchase application data was showing aggressive year-over-year declines, and the weekly data didn’t show any growth at all while mortgage rates were rising aggressively.
The second half of 2022 was a rough time for the housing market, up until November. Once rates started to fall and head lower with some consistency, we had seven weeks of a positive trend in the purchase application data.
This also means the completed sales from these applications won’t show up in November or even as part of the December existing home sales report. However, looking at the January and February existing home sales reports, which will be released in February and March, we should see the bleeding stop in the existing home sales data.
The seasonality of purchase application data traditionally means volumes rise after the second week of January through the first week of May. Traditionally after May, volumes fall, so it’s critical to show some discipline in reading the data during the first few months of the year.
Since we were working from an extreme dive in purchase application data for most of the year in 2022, context will be crucial. However, what we have seen since November should be encouraging for the housing market. For now, just think about stabilization, working from a low bar, and we will take this data one week at a time in 2023.
Remember that we wiped out seven years of growth in this data line in just one year in 2022; this was an epic dive in the data line.
Weekly housing inventory
The last few weeks have seen a noticeable decline in inventory. Most of that decline can be attributed to the seasonal decrease we see every year, but a partial amount can be attributed to rising demand.
Let me connect the dots here: On Oct. 28, Altos Research’s weekly data reported a peak of total single-family inventory of 577,172. As of last week, that inventory fell to 490,809. Traditionally we see inventory fall during the fall and winter months. However, in the last two weeks of 2022, some decline can be linked to the better demand we have seen since mid-November in the purchase application data.
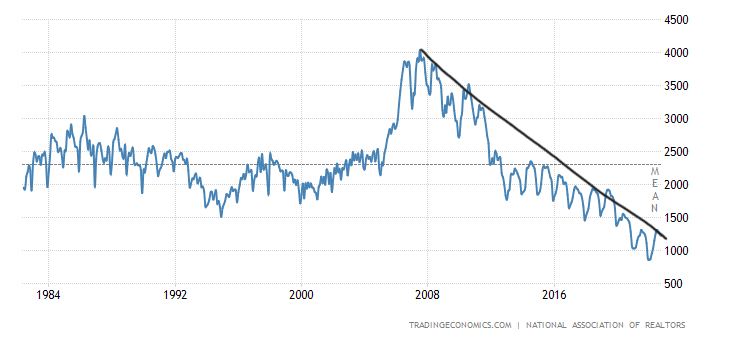
It’s now 2023 and total inventory is low by every measure of the existing home sales market. On a historical basis using data from the National Association of Realtors, total inventory has the capacity over the next two existing home sales reports to break under 1 million.
If this happens, it will be only the second time in recent history that we start a calender year below 1 million active listings. Mind that we have over 330 million people in America now and compare this to the active listings we had in the 1980s with fewer people in the chart below. Currently running off the November report only, total inventory is running at 1.14 million and has fallen for four months.
I am not a big fan of total housing inventory being below 2019 levels nationally. The housing markets that are back to 2019 levels are excellent in my book, and as long as mortgage rates stay high, we don’t have to worry about prices rising out of control. For now, we are ok, but this is something I will be keeping an eye on all year.
The 10-year yield and mortgage rates
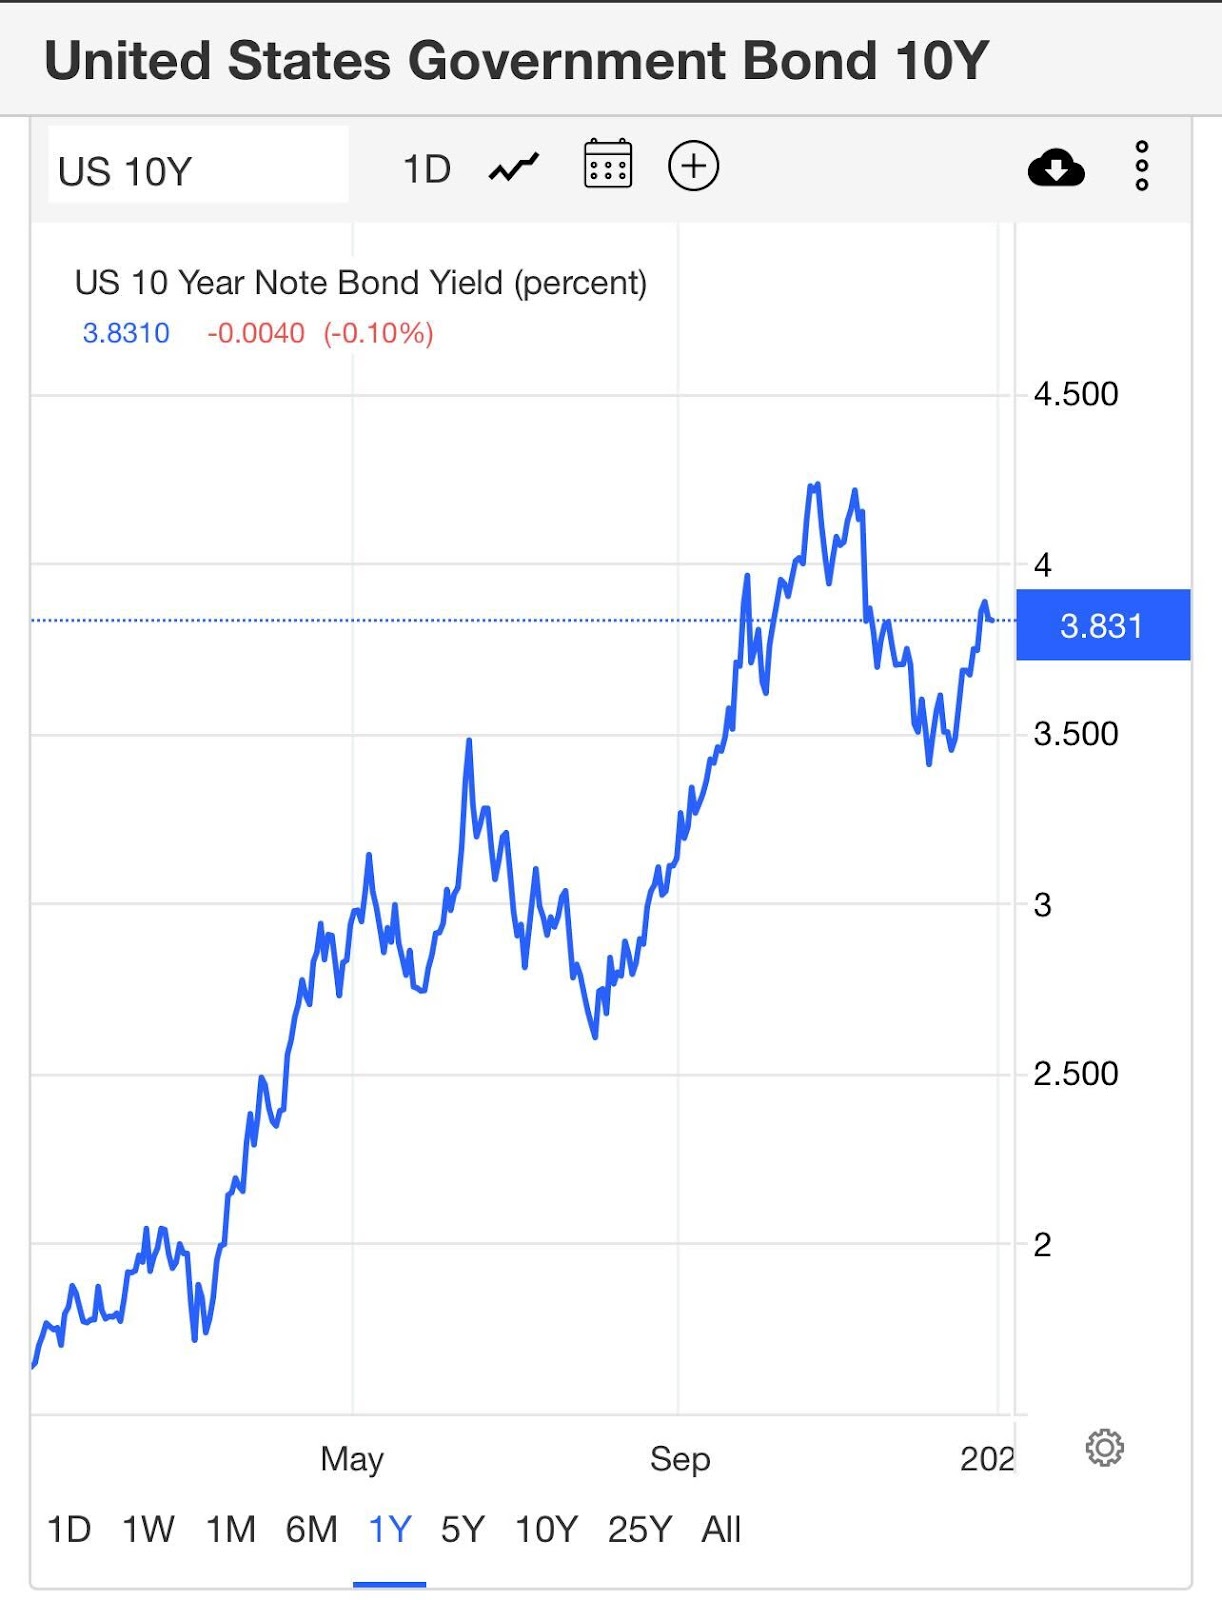
Toward the end of the year, mortgage rates headed higher as the 10-year yield sold off and went higher itself. Mortgage rates hit a high of 7.37% on Oct. 20, only to head back down to 6.12% on Dec. 15. They rose to 6.54% to close out the year.
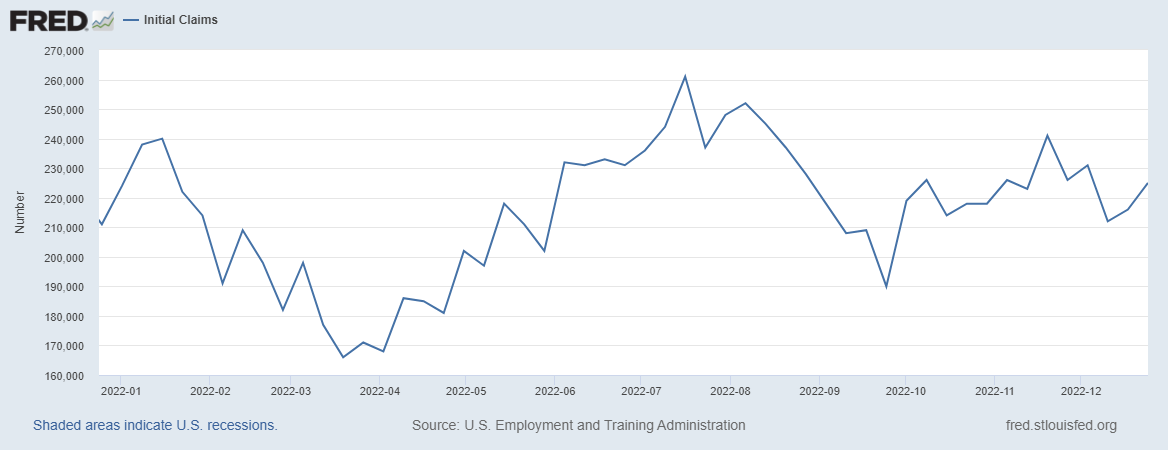
This week we have a few labor market reports that could impact mortgage rates, especially job openings and the Friday BLS jobs report. However, for this weekly tracker, we will also be keeping an eye on initial claims data released each Thursday morning.
I have been writing about the Fed pivot over the last several months, and it’s something I don’t believe we’ll see until the labor market breaks. This would mean initial claims getting above 323,000 on the four-week moving average. The recent headline print was 225,000, and the 4-week moving average was 221,000.
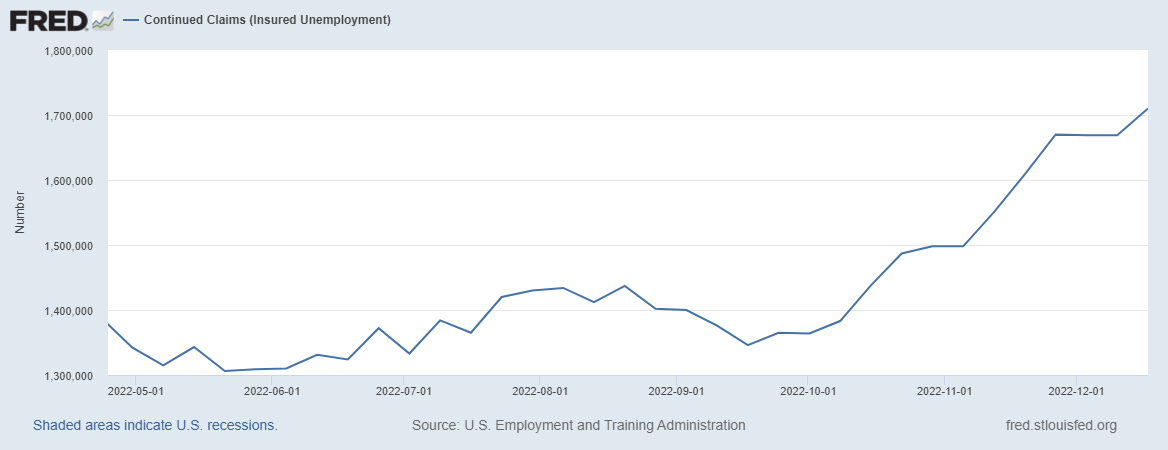
Another labor market data line to track is continuing claims — the people who have filed for jobless benefits and haven’t found work after a week. This number has been rising more steadily lately.
My 2023 forecast article will be published on Wednesday, and I’ll go into more detail about what I think about the bond market, inflation, and what to look for in 2023. However, for this weekly Housing Market Tracker article, the three topics above are what I’ll be focused on all year long.
In summary, we have no purchase application data to report from last week, but the trends have been positive, and housing inventory fell amid lower mortgage rates. We will see if the recent rate increase ends that streak of positive data.
Now that the New Year is here, it’s time to gear up for another year of weekly drama, and we will focus on the forward-looking data so you all have an idea of what is going on before the existing home sales report comes out.