Monday’s existing home sales report showed a significant decline in the year-over-year metric for May. This May report showed sales were down 26.6%, the lowest sales print since the housing bust years at just over 3.9 million.

The stay-at-home orders have severely affected demand. These low points don’t truly reflect the real fundamentals of the U.S. housing market. This is why, for many months, I have stressed we need to wait until July 15 to get a real look at the landscape for housing data.
In fact, I have noted that everyone should put an asterisk on the March, April and May data due to stay-at-home orders and that June’s report should be an excellent base to work from for the rest of the year.

Columnist
As mortgage rates stay low, I expect a rebound in the existing home sales data line in time. Don’t be surprised if we see a positive year-over-year growth print in the existing home sales report in the upcoming months. Housing data gets softer when mortgage rates get above 4.5% – outside stay-at-home orders, of course.
The median existing-home price in May was $284,600, up 2.3% from May 2019.
As I mentioned in previous articles, the median sales price before the COVID-19 crisis was getting too hot, and we should be rooting for it to come down. The rate of growth on a month-to-month basis fell, so this is a good thing. In fact, I labeled the median sales price growth above 7% that we saw earlier in the year as an unfortunate aspect for housing.
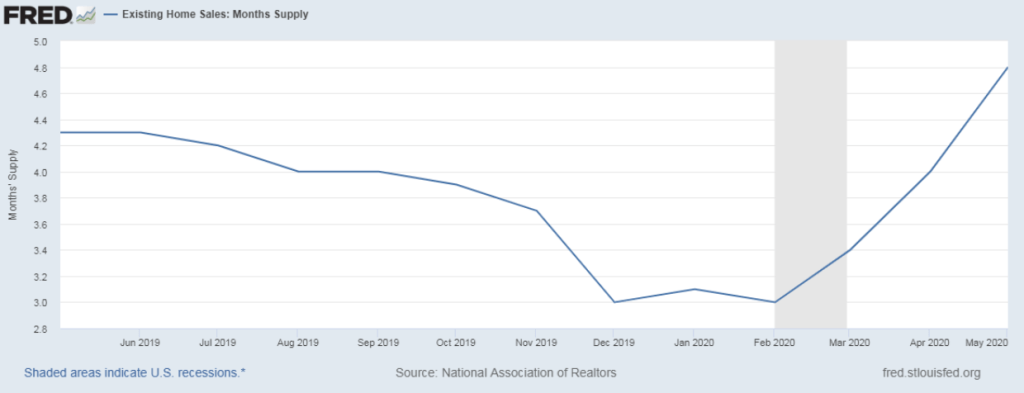
Inventory data sits at a 4.8-month supply up from 4.0 months in April and up from 4.3-months for May 2019. Monthly supply does grow during the spring and summer months and retracts in fall and winter.
We have enough supply for sales to grow as demand has picked up in the last six weeks.
As we end the month of June, we have a different perspective on U.S. economics compared to how things looked in March and April.
The stay-at-home orders and the negative year-over-year data in the purchase application data brought fear into the housing market. Now, purchase applications are at an 11-year high with double-digit growth on the four-week moving average. Other data lines, like the St. Louis Financial Stress Index, are below zero, which means less stress in the marketplace.

In the coming months, we need to see where the home sales flattened out and where the median home price growth is. We don’t want to see anything above 4.6% growth in home prices this year, 2.3% year-over-year growth, which means real home price growth is negative year over year. That would be an outstanding housing data line that should be cheered.
In the upcoming months, I know a rebound in sales is coming, but context is critical. It’s working from a stay-at-home-virus low, that is it.