Two significant things happened on Friday: the Bureau of Labor Statistics reported that the U.S. created 428,000 jobs in April, and I had to raise another recession red flag. First, let’s look at the jobs picture.
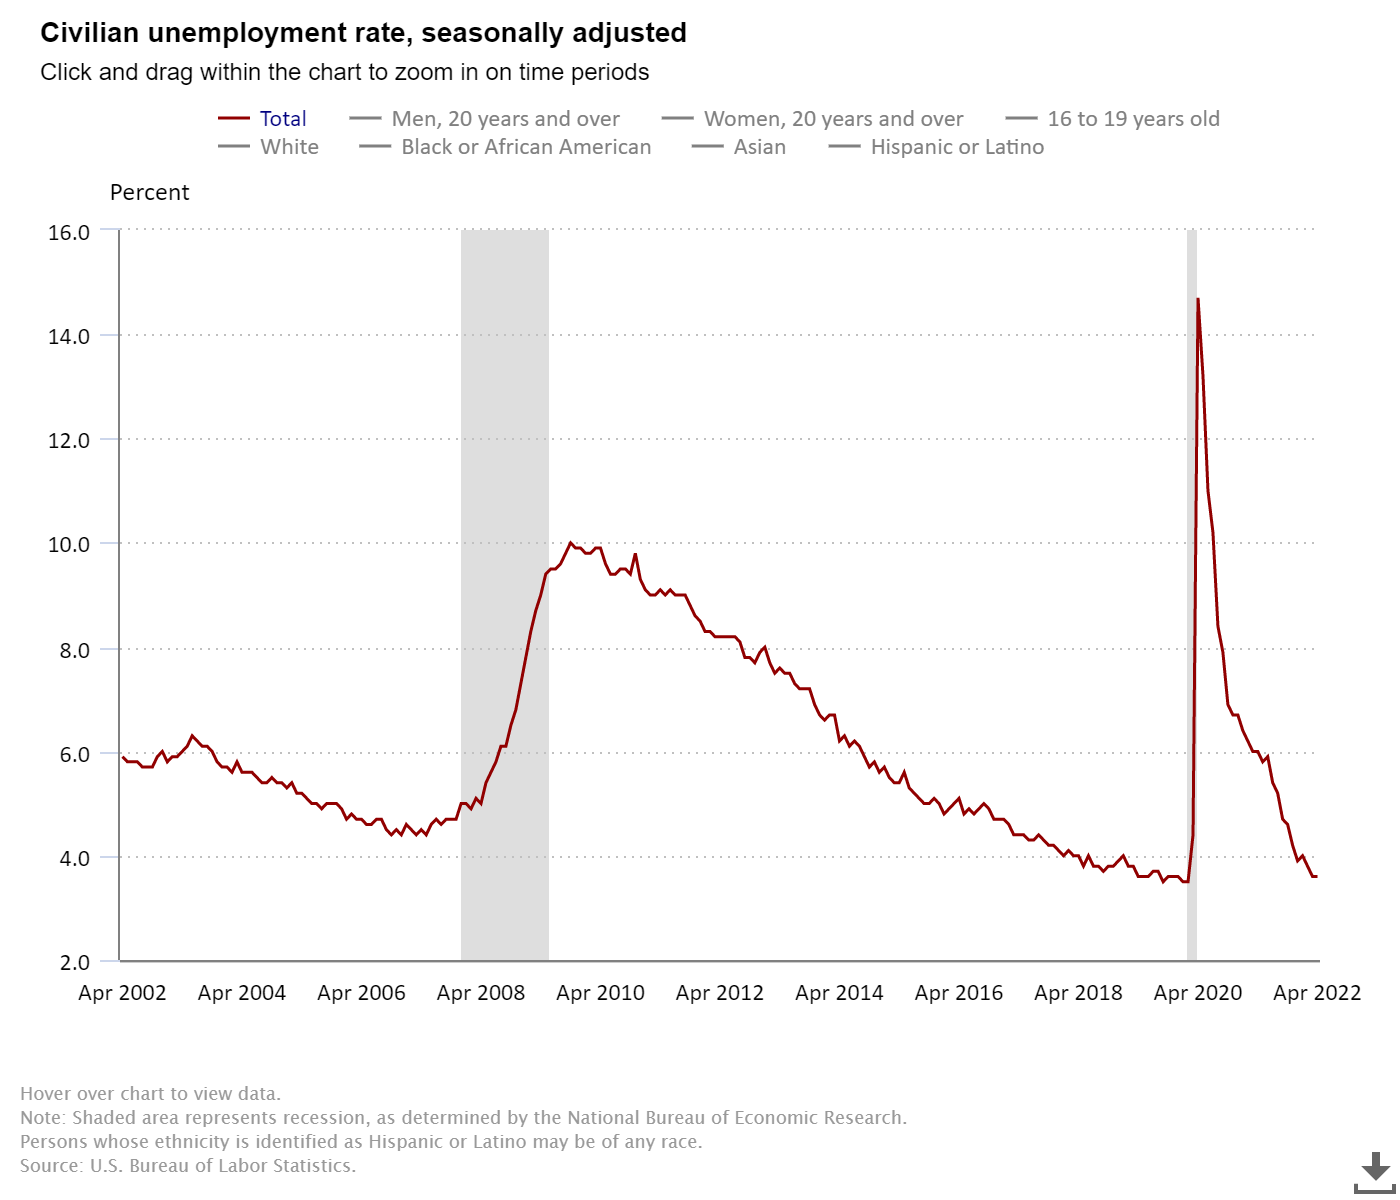
A string of positive job revisions we’ve seen this year ended with a negative 39,000 print; however, the job report was solid and continued the trend of good reports in 2022. The unemployment rate is at 3.6%, and we are getting closer and closer to my forecast of getting all the jobs lost to COVID-19 by September of 2022.
From BLS: Total nonfarm payroll employment increased by 428,000 in April, and the unemployment rate was unchanged at 3.6 percent, the U.S. Bureau of Labor Statistics reported today. Job growth was widespread, led by gains in leisure and hospitality, in manufacturing, and in transportation and warehousing.
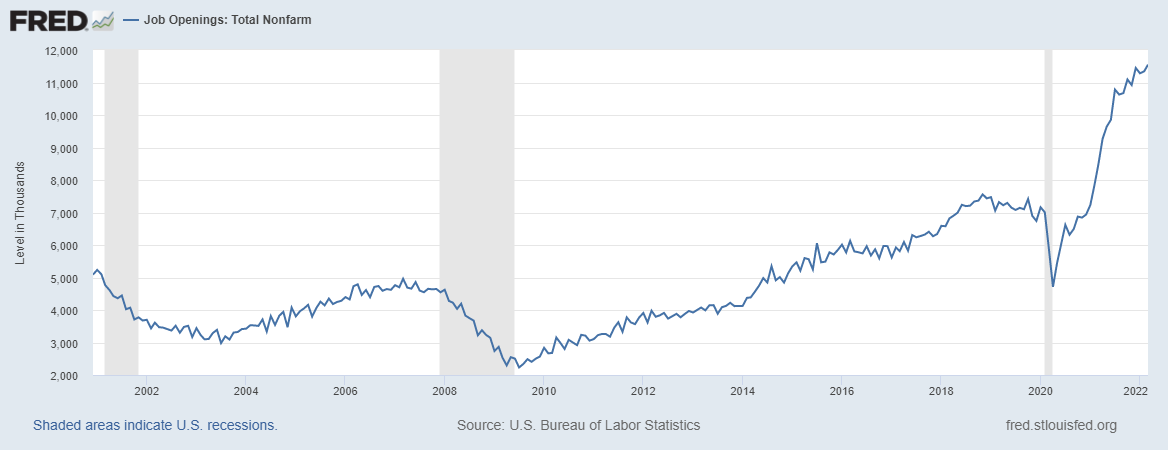
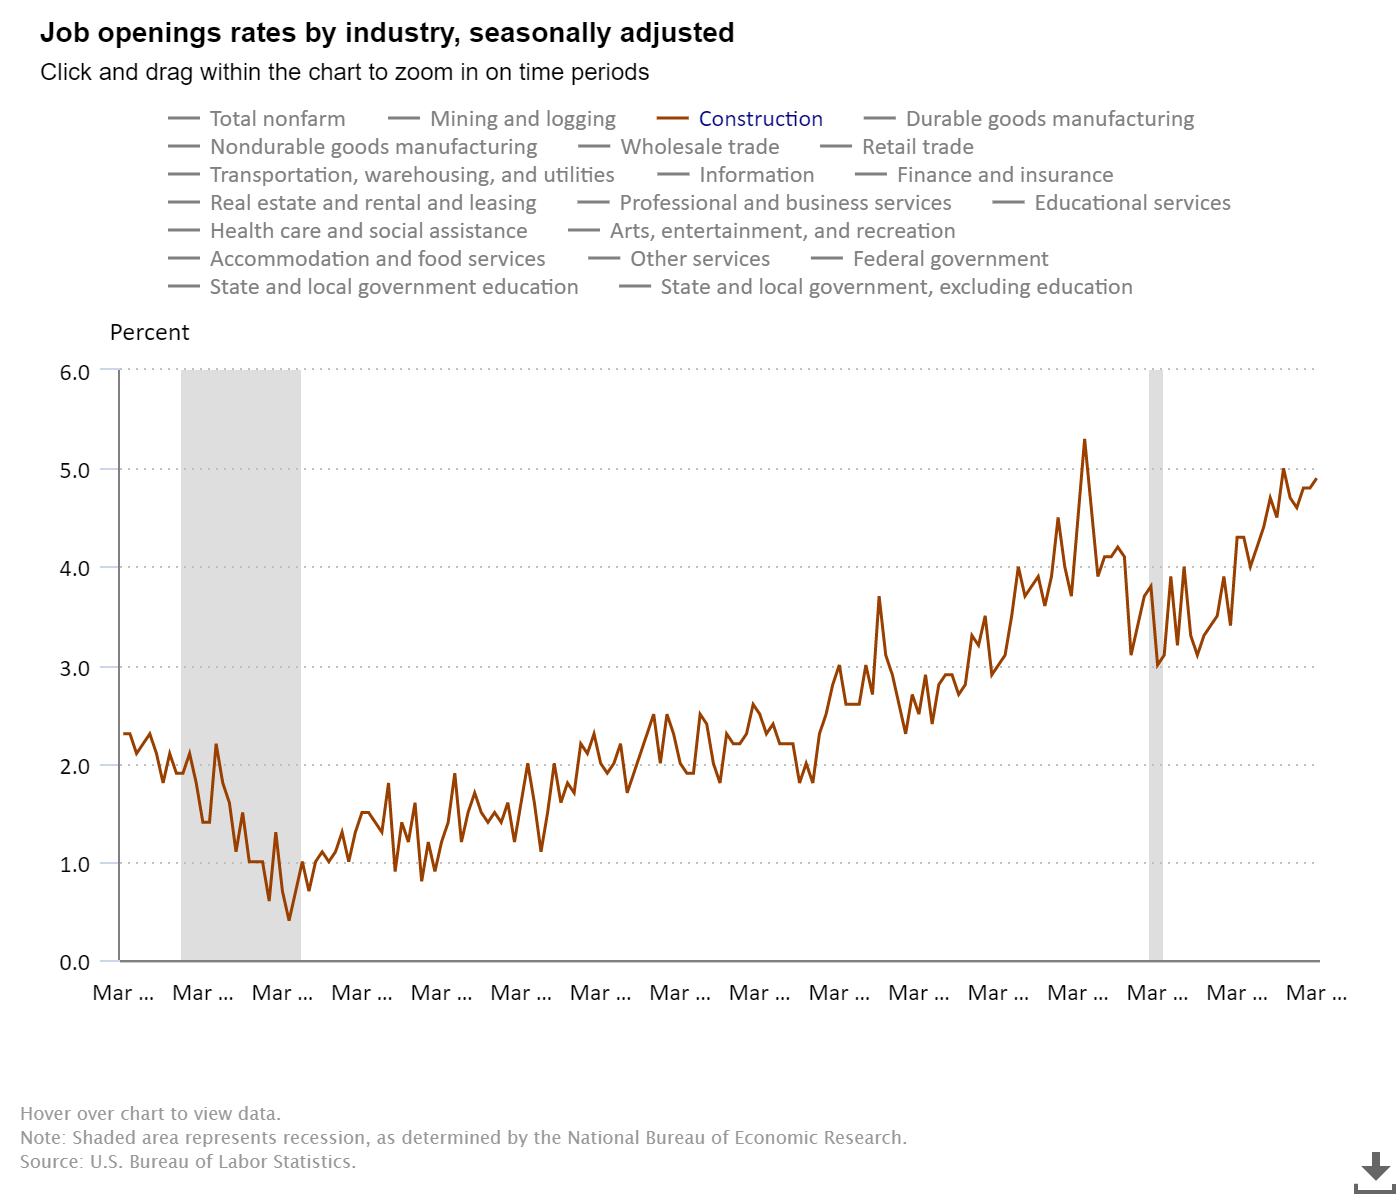
The internals of the labor market are very healthy; job openings are over 11.5 million. A year ago I wrote and tweeted that we should get job openings over 10 million in this recovery, so this isn’t surprising, but it’s still shocking to see such high job openings on this report. Remember, the trend has been your friend since 2009: the Baby Boomers can’t work forever, and no country has a Dorian Gray labor market. In time, older workers need to be replaced.
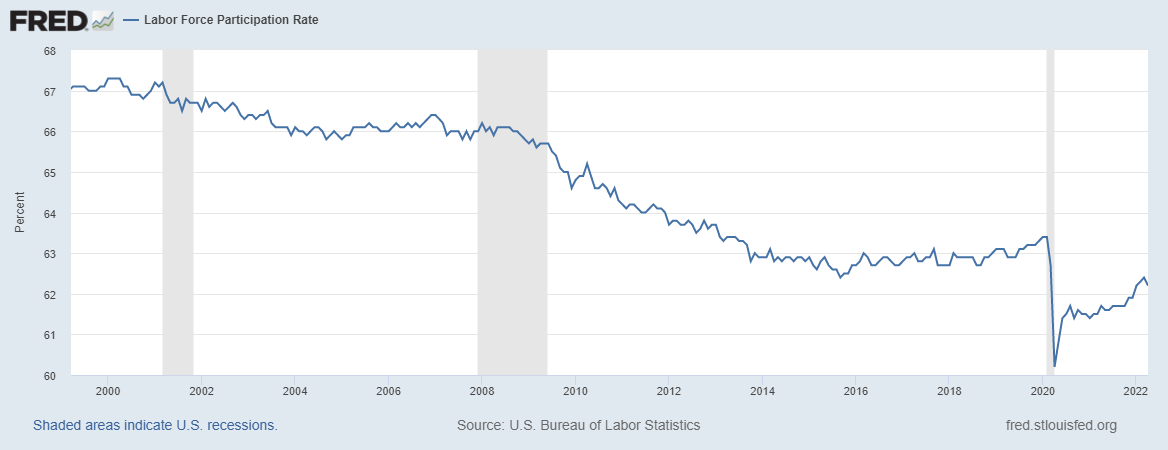
I never talk about labor force participation rates because it is the most useless labor data we have. Everyone had forecasted this data line to fall in the 21st century, and it has; nothing is wrong with this. People generally make too much of this data because it makes a sexy headline. So the fact that this fell means nothing to me, nor will it ever in my life. It won’t mean anything to me in the afterlife, either.
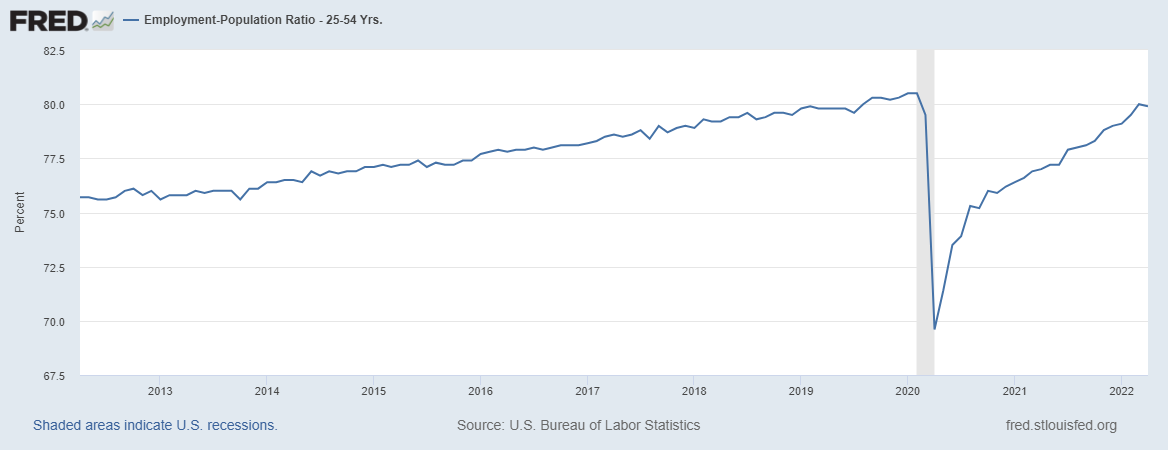
The data line that I track that matters most will always be prime-age employment to the population data because that is the proper working-age workforce, not people 16-24 or 55 and over. The employment-to-population percentage for the prime-age labor force fell in this report, but is 0.6% away from being back to February 2020 levels. The jobs recovery in this new expansion has been much better than we saw during the recovery phase after the great financial crisis.
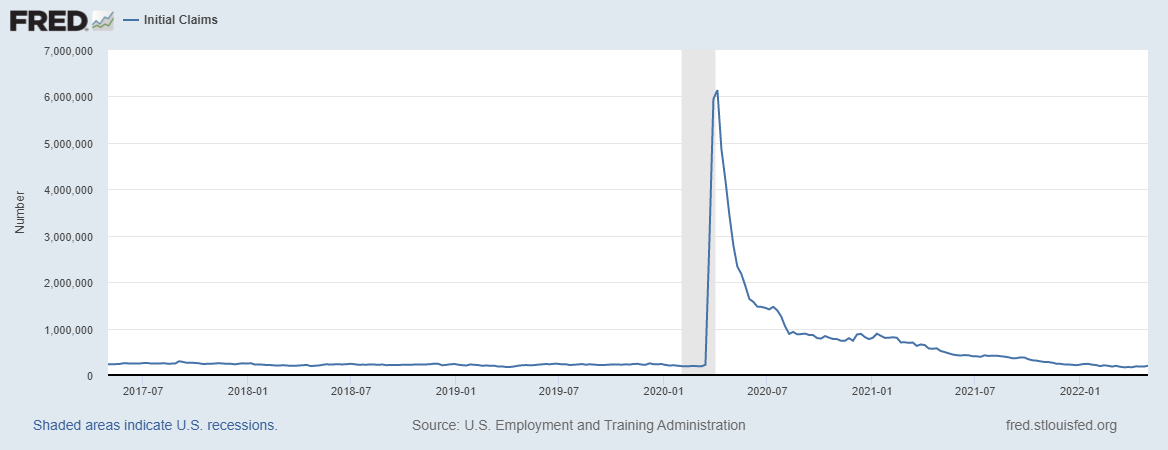
The current jobless claims data is very low historically, as the hunt for labor and making sure to retain workers is a real issue for companies. This is a weekly data line that has been in a downtrend for some time.
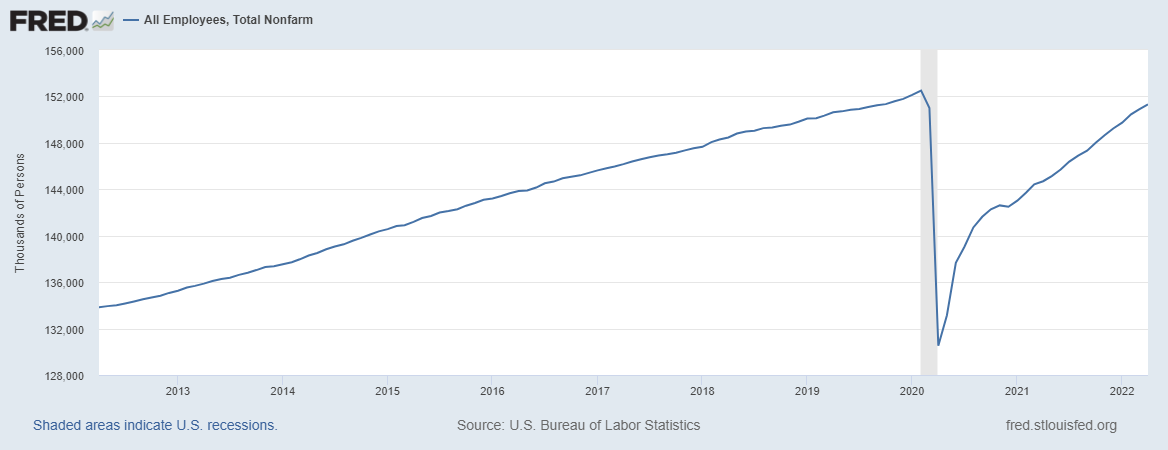
Even though I retired my America Is Back Recovery model on Dec. 9, 2020, I knew getting all the jobs back lost to COVID-19 would take some time. So, September of 2022 was the target date that I believe we will achieve those pre-COVID-19 levels. Of course, we had to deal with Delta and Omicron variants, but still, we are on pace to get all the jobs back by September of this year.
—Feb 2020: 152,553,000 jobs
—May 6, 2022: 151,314,000 jobs
That leaves us with 1,239,000 jobs left to make up over the next five months, which means we need to average adding 247,800 jobs per month. The unemployment rate currently stands at 3.6%.
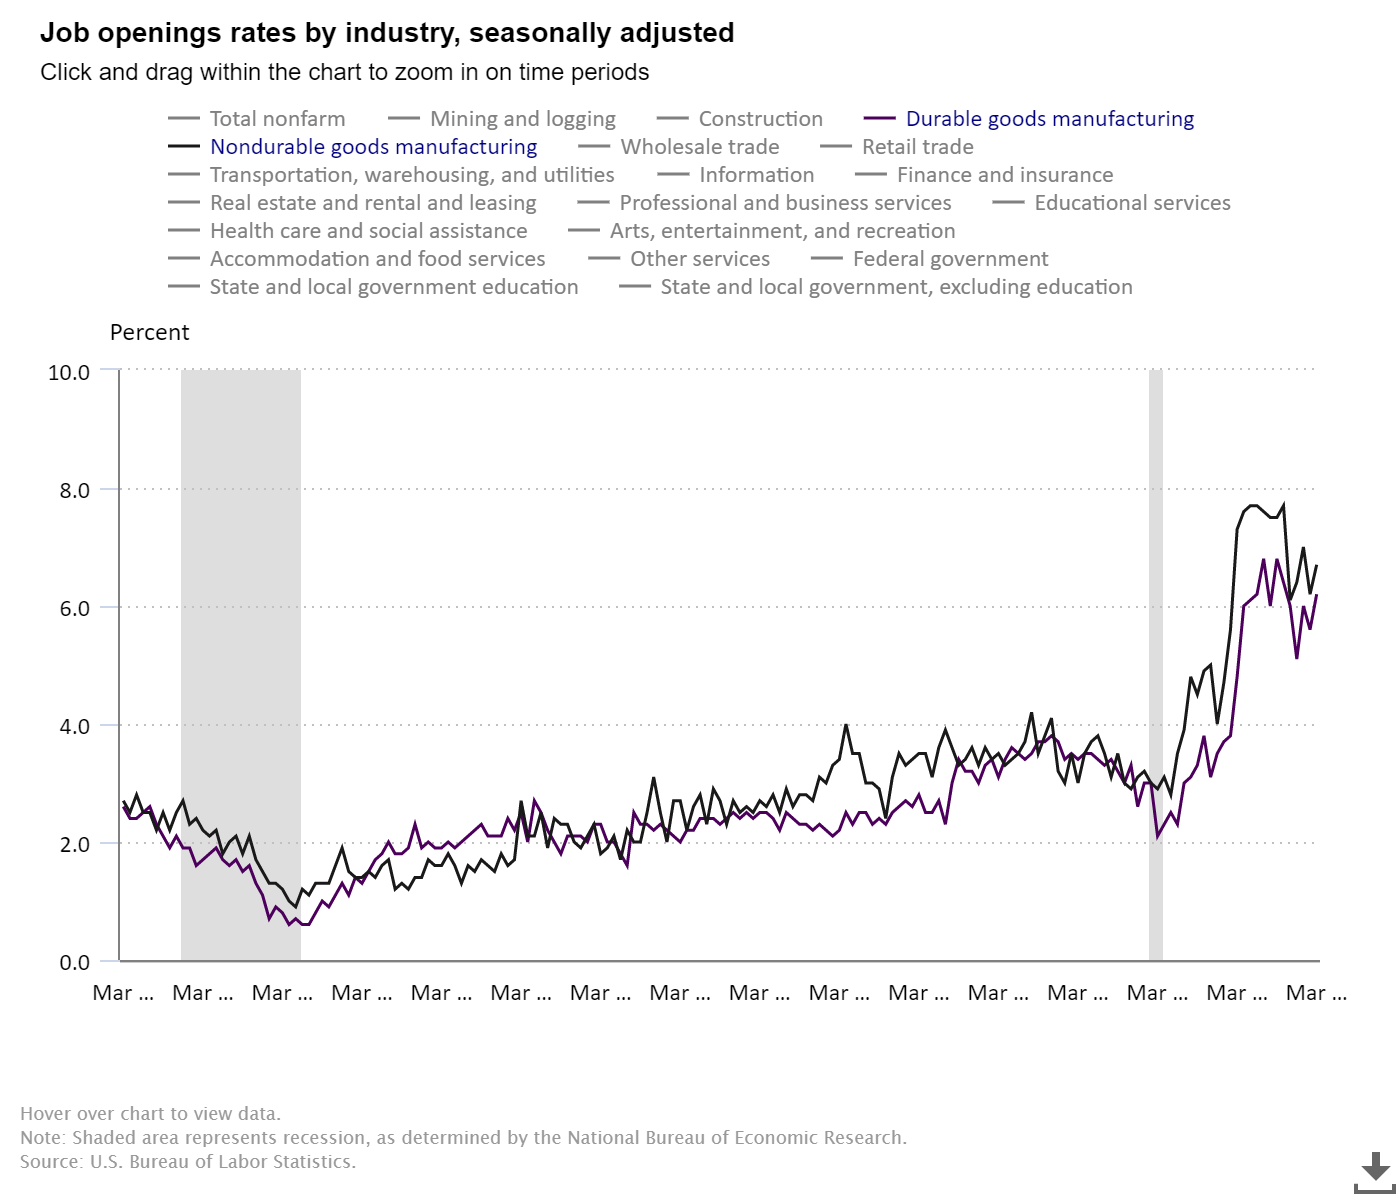
Look at the jobs data and which sector added jobs in March: Construction jobs came in positively, but the real winner was manufacturing jobs.
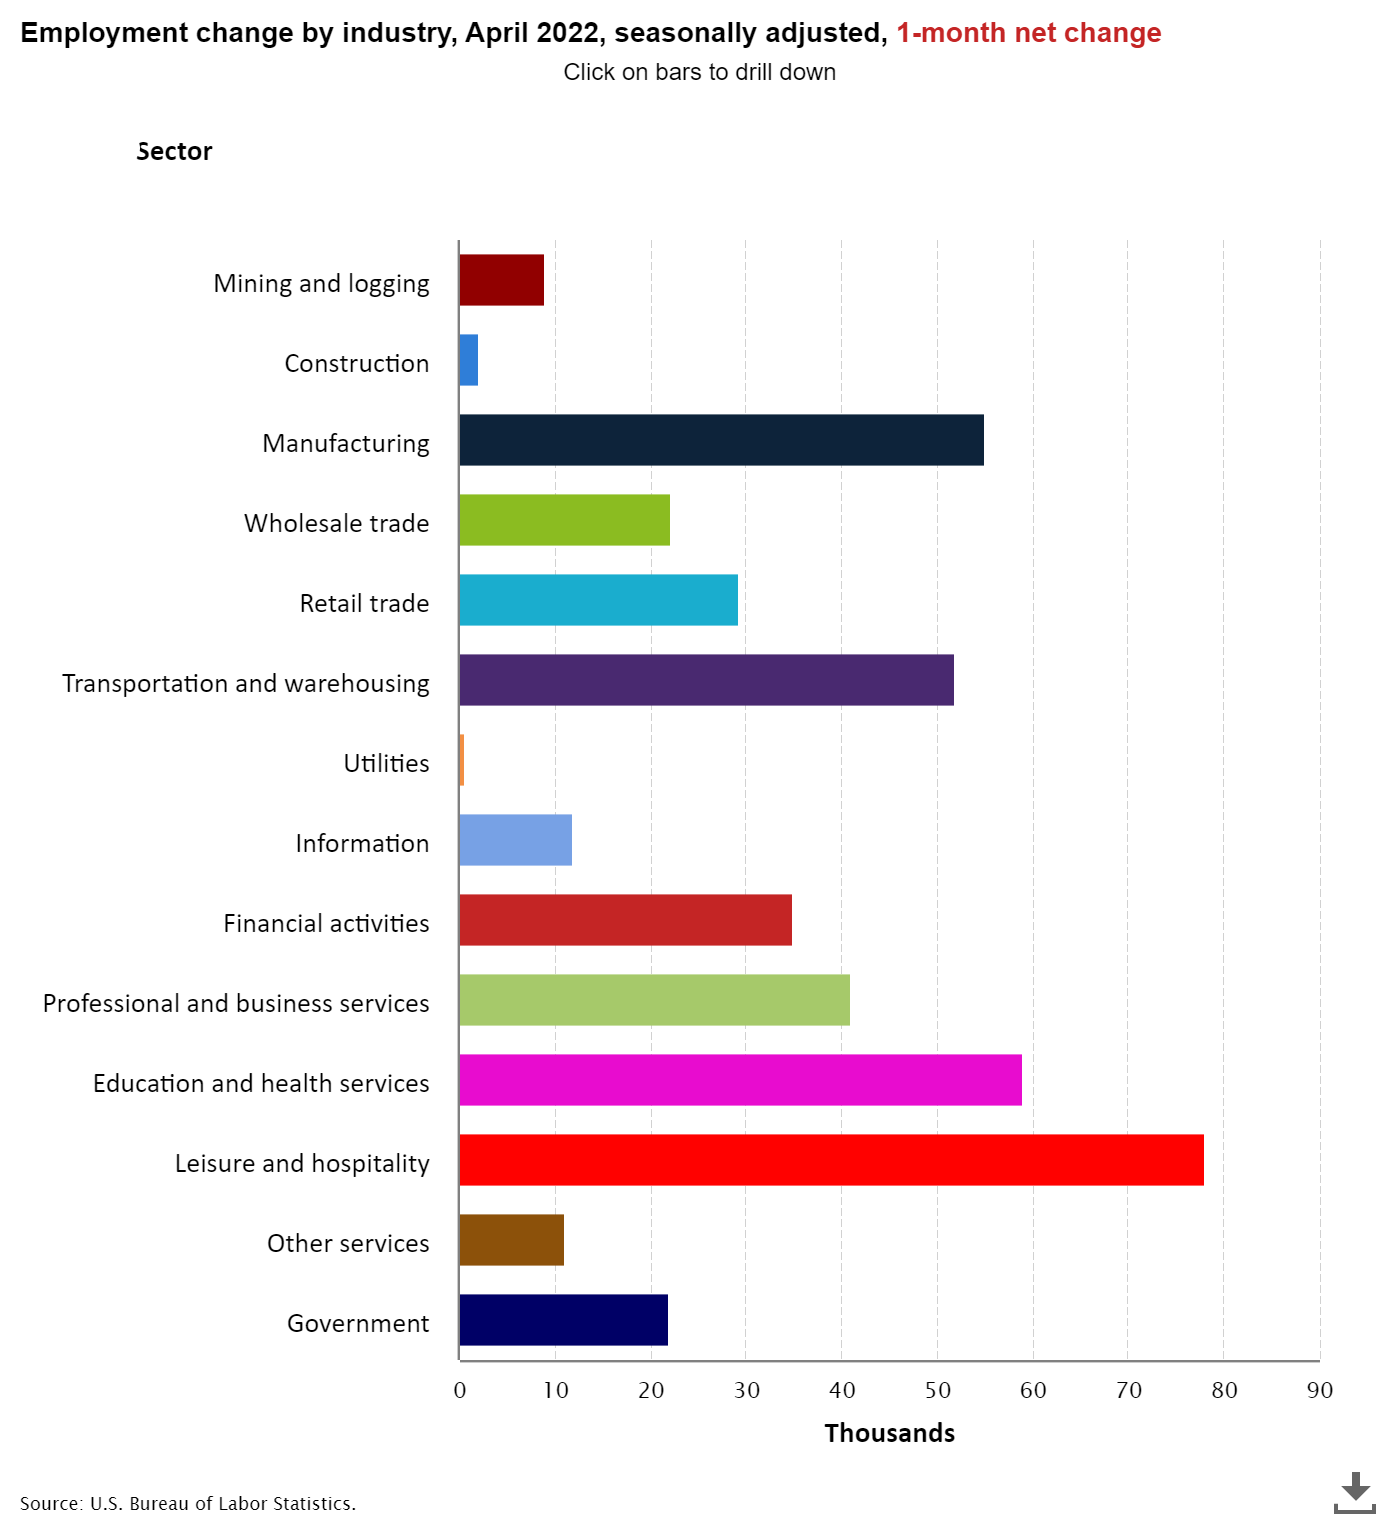
Job openings in construction and manufacturing are big in America today. The notion that robots and immigrants took all the jobs was simply a joke.
As we can see, the labor market is solid and has some legs. When the economy is back to normal, I expect to see much smaller job gains as our country lacks the population growth to have big job numbers unless it’s coming off a recession.
Now to the second big news: the recession red flags.
Recession red flag model: 4th flag raised today
For every recovery model, you need to have a recessionary model. Traditional cycles can be forecasted correctly; it makes things interesting when you get a shock like COVID-19. The United States of America was still in an expansionary mode in 2019 and 2020 before COVID-19 hit us. For a more traditional economic expansion and recession, here is the model backtested with the housing bubble years, in which the red flags were all up in 2006.
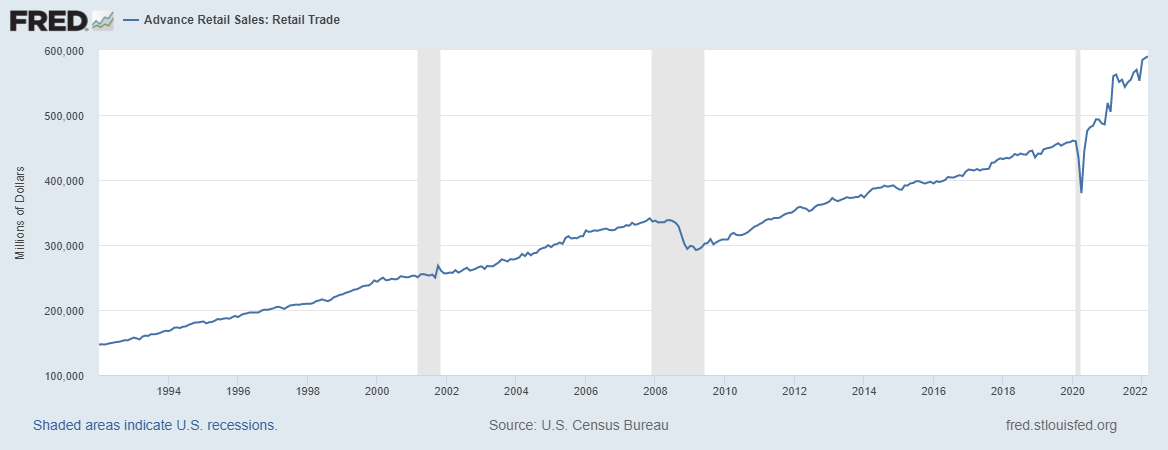
The fourth recession red flag looks for over-investment in the economic cycle. What sector was so hot that the demand for that sector couldn’t be sustained? Retail sales, durable goods spending, and the e-commerce side of this expansion saw an epic boom due to COVID-19. Now those stocks are getting deflated and the demand for durable goods can’t be sustained.
I use the company Peloton and their boom-and-bust cycle as an example of what a job-loss recession looks like. This company had booming demand, and then that demand collapsed, leaving them with too many workers that they had to fire. It also derailed their plans for a manufacturing plant to build more bikes.
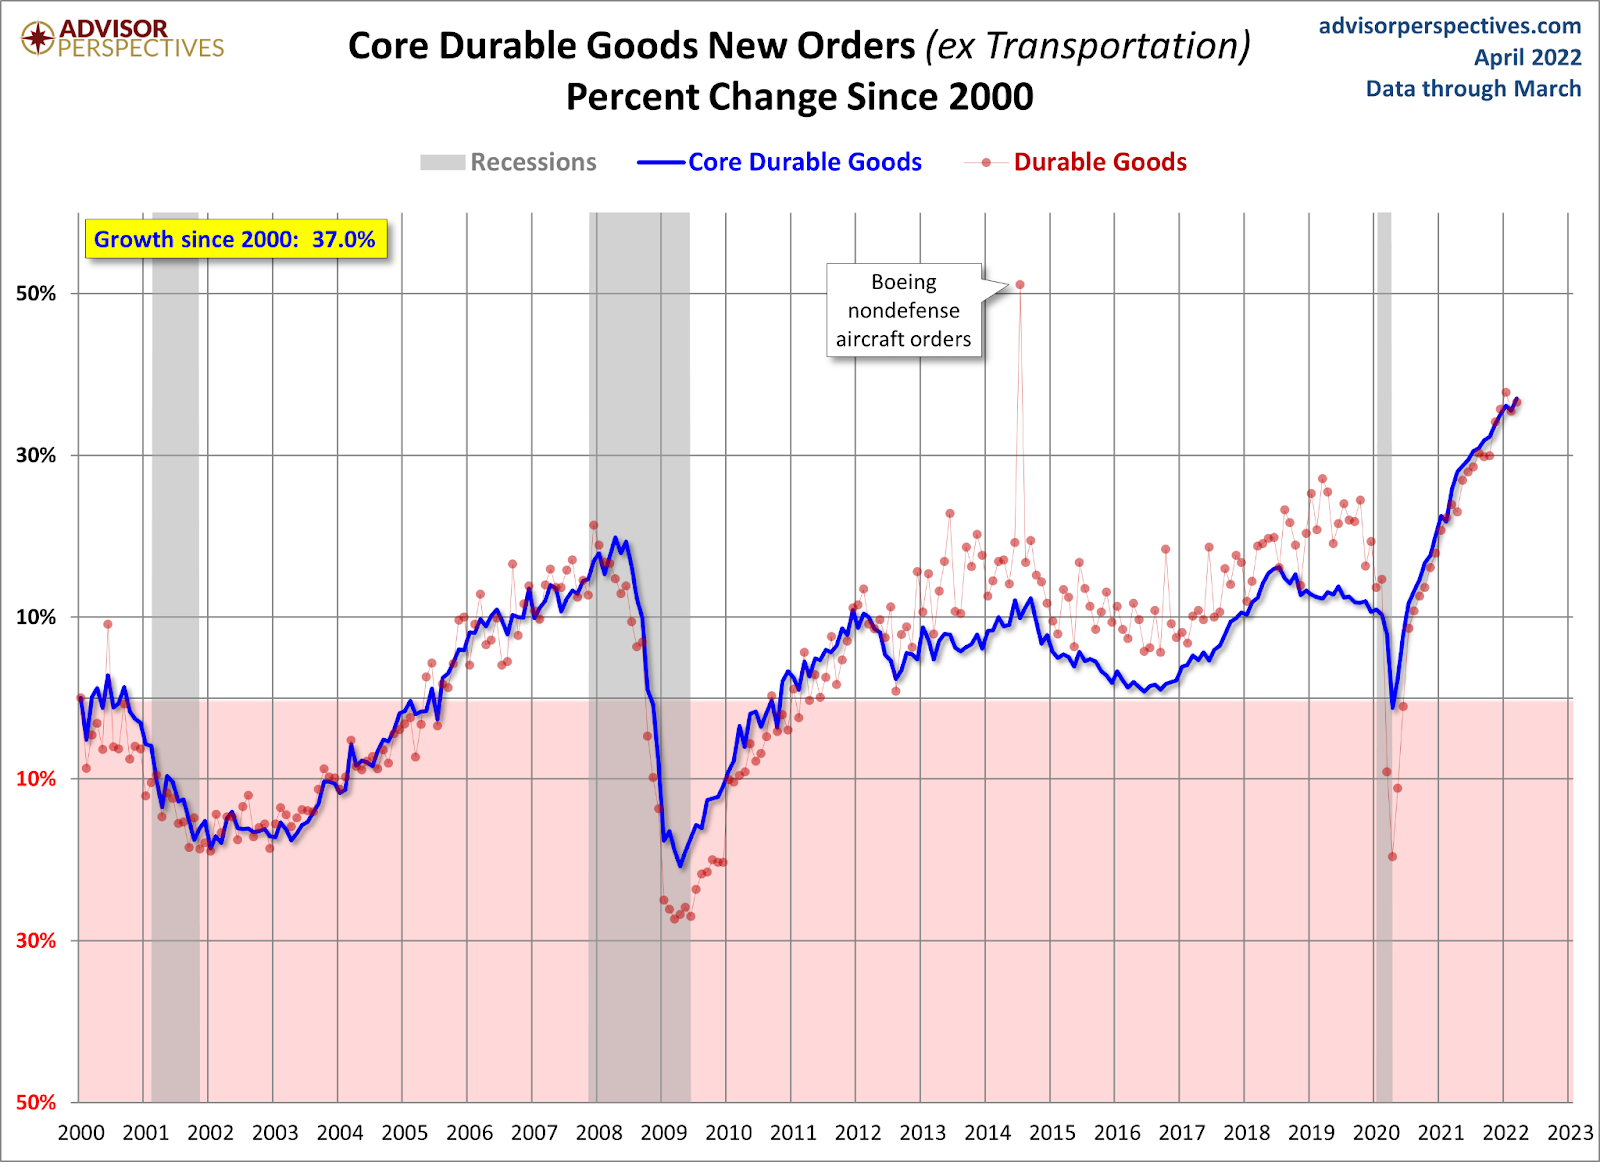
Amazon recently spoke about being too big and having too much capacity after the massive surge in consumer demand. As demand normalizes, the need for this much labor and capacity doesn’t seem apparent anymore. This is very common in boom-and-bust cycles where for some time you need more people and capacity to fill in demand, but if that demand doesn’t sustain itself, you will have spare capacity. If you want to hear some encouraging news about the growth rate of inflation peaking out, this news from Amazon is it.
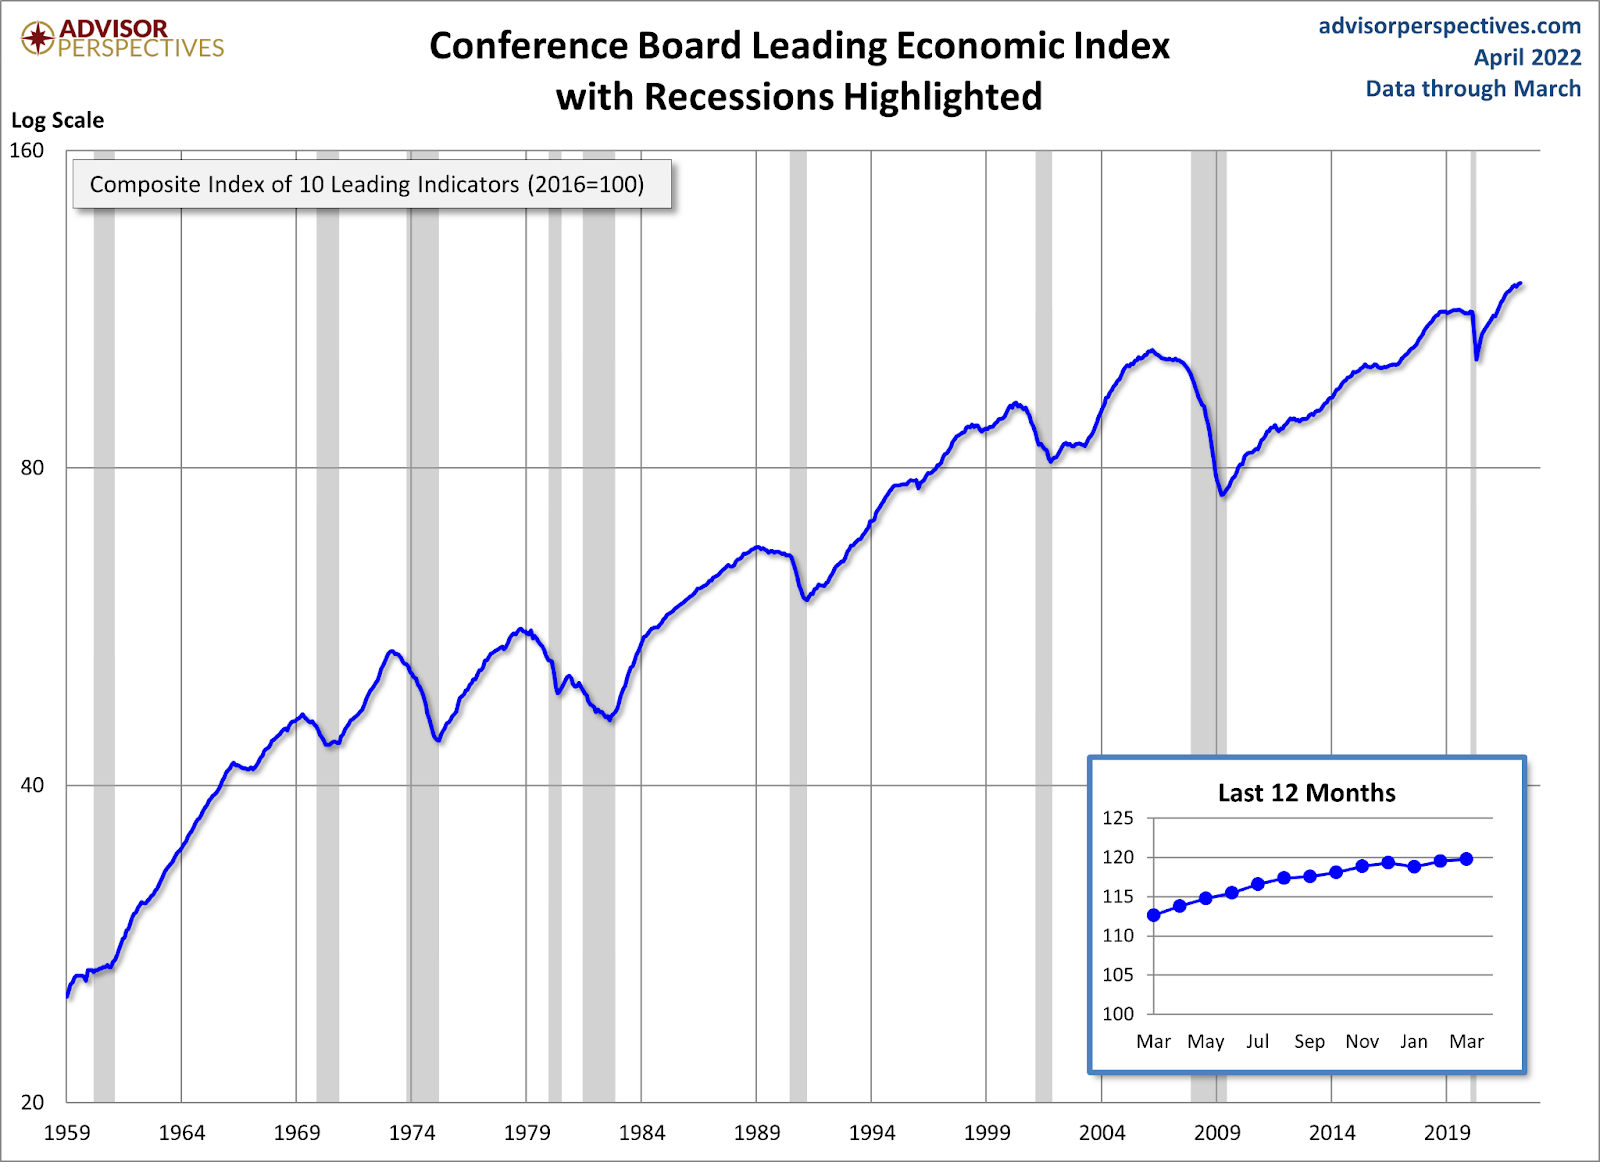
There are two final recession flags, which are always the most important.
— The Leading Economic Index falls four to six months before every recession. Of course, this hasn’t happened, but this data line had an epic recovery from April 2020, the same month I wrote the America is Back Recovery model.
— New home sales and housing starts traditionally fall into a recession. This is where the 5% plus mortgage rate world can facilitate this red flag going up. So far, this hasn’t been the case, but this is 100% something we need to focus on.
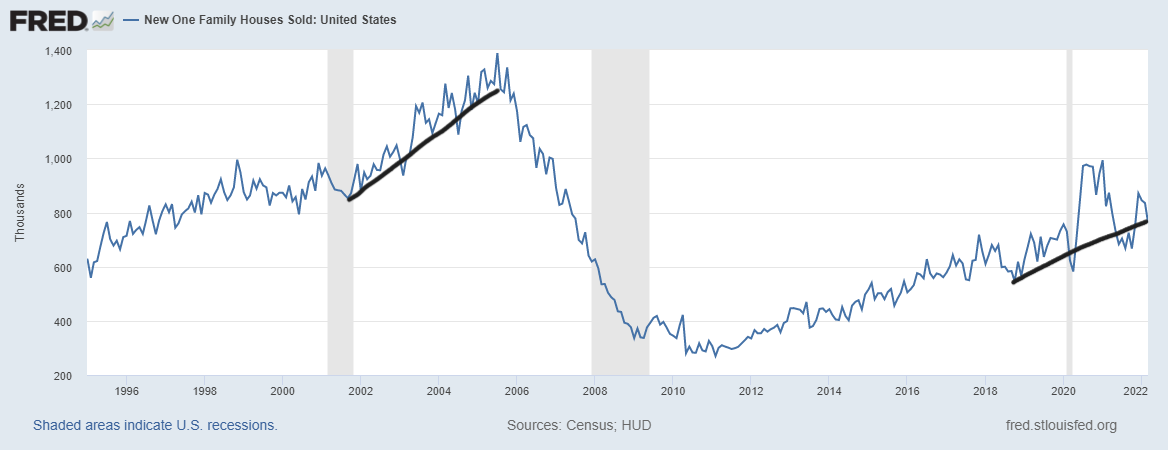
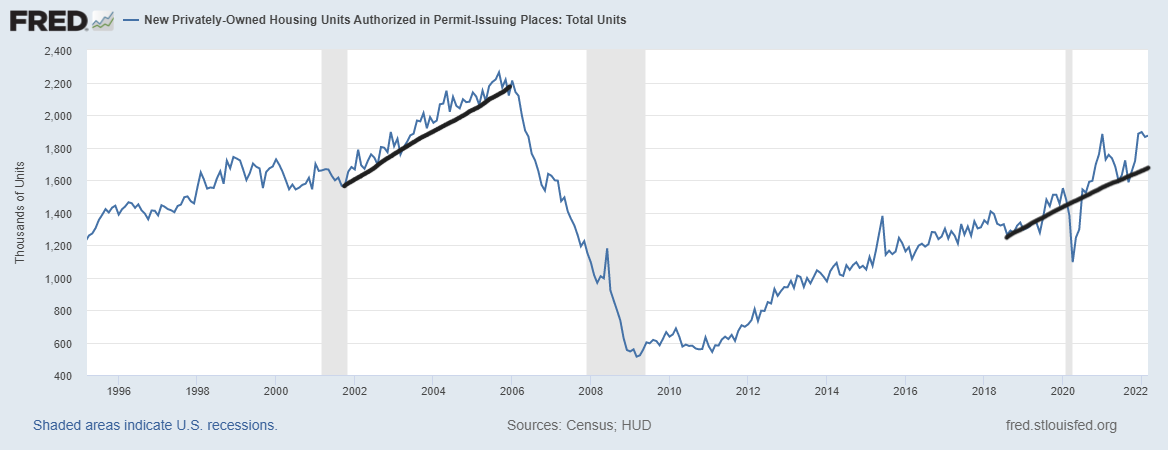
As an economic expansion matures, we always look at different variables. Housing holds a key right now as the last two recession red flags would need real estate to get weaker for us to discuss a recession. Of course, the Russian invasion of Ukraine and the China lockdowns are out of our control, but we can still create models that factor them in our expansion and recession. Ultimately, it will be all about the U.S. consumer, who has always been our engine of economic growth, and we will see if they can keep the last two flags from being raised.


The upcoming summer months should portend the trajectory of housing inventory and pricing. That will show us where the economy is heading. My guess is housing inventory will increase and the average price will moderate and eventually drop to early 2020 levels.
Rob, prices went up nearly 40% since 2020, and inventory is rising, but we are well below 2019 levels. We are back to a regular market once total inventory levels get back to 1.52 – 1.93 million. We are currently at 1,030,000, and we are in June. Inventory should increase with rising rates, but those price declines within 90 days aren’t in the works this year.