In November, defect risk climbed across the country, partially attributed to the growing defect risk of areas affected by California's recent wildfires, according to the latest First American Loan Application Defect Index.
According to the report, the frequency of defects, fraudulence and misrepresentation in the information submitted in mortgage loan applications rose 2.5% from the previous month but fell 2.4% from November 2017.
Nationally, the Defect Index for refinance transactions moved forward 2.8% from October and is up 5.8% from the same time a year ago. Furthermore, the Defect Index for purchase transactions climbed 2.4% from October but remains 7.7% down from 2017.
First American Chief Economist Mark Fleming said the question is not if defect risk will continue to increase, but when will it stop.
“The tragic impacts of the Woolsey and Camp fires continue to be assessed and, unfortunately, appear to include rising fraud and defect risk,” Fleming said. “Given historical trends, the question is not if defect risk will continue to increase, but when will it stop.”
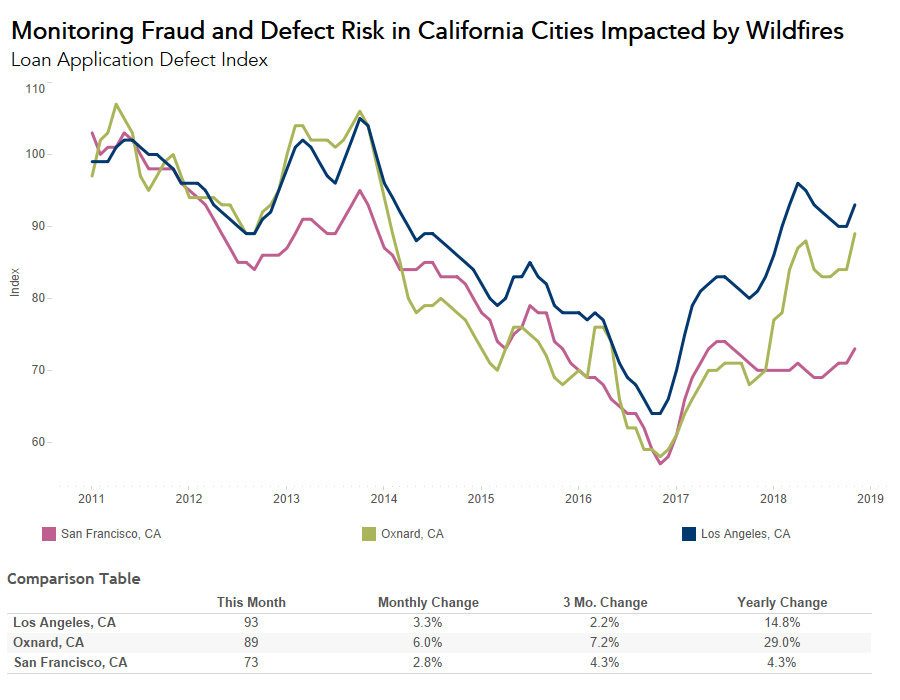
The image below highlights the defect risk in areas impacted by the wildfires:
(Click to enlarge)
First American explained that the Camp Fire in Butte County impacted 16,735 properties worth $3.8 billion dollars, and the Woolsey Fire destroyed over 1,600 structures, according to data from DataTree.
Notably, the report points out that prior to November, defect and fraud risk was relatively flat in these metropolitan areas. However, risks have increased in all three of the affected metropolitan areas.
In fact, fraud and defect risk rose 6% in Oxnard County, California, marking the greatest increase. This was followed by a 3.3% increase in Los Angeles and a 2.8% rise in San Francisco.
NOTE: First American’s Loan Application Defect Index measures the frequency of which defect indicators are identified. The index is benchmarked to a value of 100 in January 2011, meaning all index values are interpreted as the percentage change in defect frequency relative to that time, according to the company.


