For the second consecutive month, annual home price gains have slowed across the country, according to the latest Case-Shiller Home Price Index from S&P Dow Jones Indices and CoreLogic.
The report's results showed that September 2018 saw an increase of 5.5% for the year for home prices nationwide, retreating from 5.7% from the previous month's report.
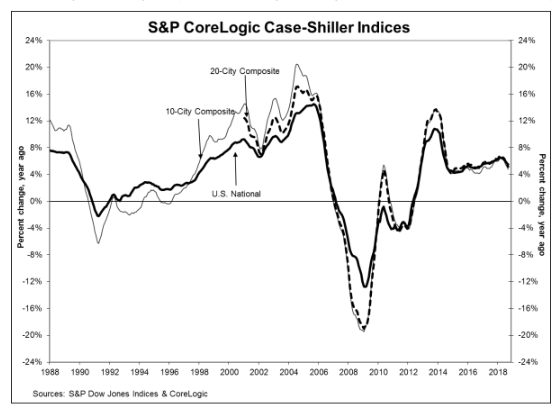
The graph below highlights that average home prices within the 10-City and 20-City Composites.
(click to enlarge)
Before seasonal adjustment, the National Index increased 0.1% month-over-month in September. The 10-city composite came in at 4.8%, falling from 5.2% the month before. Furthermore, the 20-city composite posted a 5.1% year-over-year gain, sliding from 5.5% in August.
After seasonal adjustment, the National Index recorded a month-over-month gain of 0.4% in September.
The 10-city and 20-city composites did not report any increases for the month. Before seasonal adjustment, nine of 20 cities reported increases, while 18 of 20 cities reported increases after the seasonal adjustment.
S&P Dow Jones Indices Managing Director and Chairman of the Index Committee David Blitzer said home prices plus data on house sales and construction confirm the slowdown in housing.
“The S&P CoreLogic Case-Shiller National Index showed a 5.5% year-over-year gain, weaker for the second month in a row as 16 of 20 cities showed smaller annual price gains,” Blitzer said. “On a monthly basis, nine cities saw prices decline in September compared to August.”
“In Seattle, where prices were rising at double-digit annual rates a few months ago, prices dropped last month, Blitzer continued. “The few places reporting larger gains including some of the cities which had the biggest gains and largest losses 10 years ago: Las Vegas, Phoenix and Tampa.”
Las Vegas, San Francisco and Seattle continue to have the highest year-over-year gains among all 20 cities. Unsurprisingly, Las Vegas had the highest year-over-year price increase of 13.5%, San Francisco climbed 9.9% and Seattle saw a 8.4% price increase.
Notably, Four of the 20 cities reported greater price increases in the year ending September 2018 when compared to the year ending August 2018.
Blitzer added that although sales of both new and existing single-family homes peaked in November 2017, sales of existing homes have fallen 9.3% from that peak.
“Housing starts are down 8.7% from November of last year. The National Association of Home Builders sentiment index dropped seven points to 60, its lowest level in two years,” Blitzer said. “One factor contributing to the weaker housing market is the recent increase in mortgage rates. Currently the national average for a 30-year fixed rate loan is 4.9%, a full percentage point higher than a year ago.”