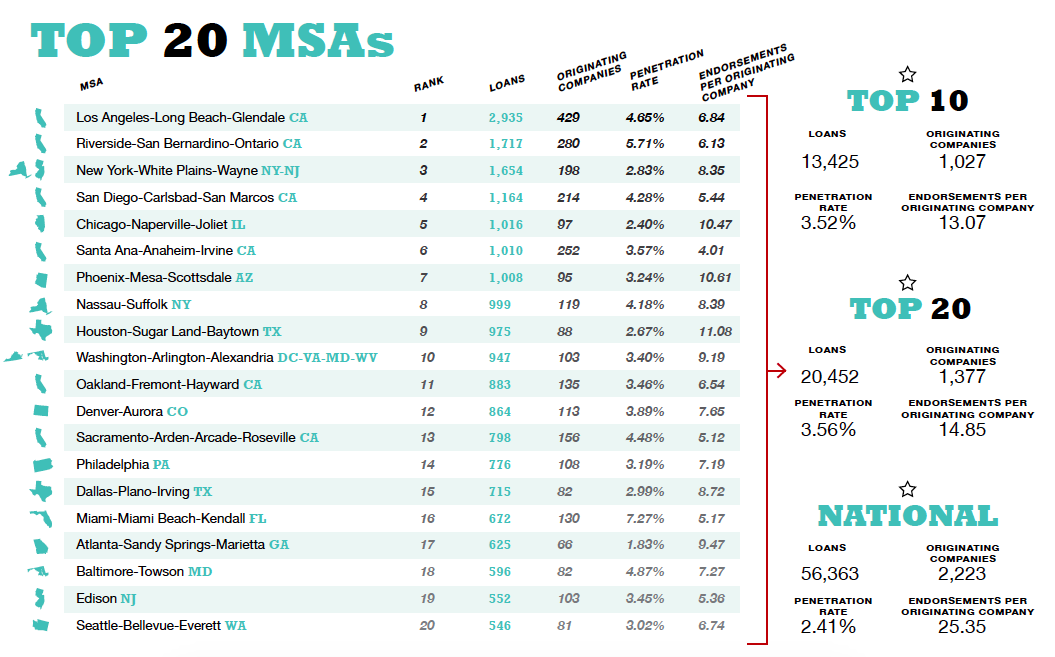
In a review of the HECM’s top 20 MSAs (metropolitan statistical areas), there are a few messages that shouldn’t be ignored. These messages indicate an expanding number of originators (actively originating companies), an increased number of endorsements, a possible connection between the two, and an increase in endorsements per originator.
As we look at the top 20, we need to note the following:
They represent 36.3 percent of all endorsements.
They include 23 percent of all age-eligible homeowner households.
They indicate a 3.65 percent penetration rate (the percentage of age-eligible homeowner households with an active reverse mortgage today), compared with the national average of 2.41 percent.
In 2015, they endorsed 3.3 loans per 1,000 age-eligible homeowner households (the national endorsement rate is 2.1 per 1,000).
They boast a collective 12.22 percent growth in endorsement volume (past 12 months), in contrast to the national growth of 2.41 percent.
Here is a list of MSAs, their rank and an abbreviated list of variables reviewed.
Expansion of an Active Marketplace Among the top 20 MSAs, 70 percent experienced an increase in originators. Those that experienced a decrease did so by only single digits. The top 20 MSAs collectively expanded by 159 active originators, translating to a 13.05 percent increase. This increase in the number of active companies within the top MSAs is particularly interesting when compared with an overall industry expansion of 8.49 percent.
Growth in Production Adjacent to an expanding number of originators, the top 20 MSAs yielded 12.22 percent growth versus the 2.41 percent nationwide. About 75 percent of the top MSAs showed growth, with only one (Philadelphia) experiencing a double-digit decline. Notably, 11 of the 15 areas that experienced growth did so with double-digit movement! As our market continues to mature, it is a positive message to see this collective growth across a number of the top markets—even when industry growth may not feel entirely optimistic.
Connecting Expansion & Growth When stacked side by side, it is hard to say which is more influential. Did the increase in originators drive greater growth, or did growth in production allow an increase in the number of originators? Answering that question may be helpful someday, but it isn’t critical at this moment. Instead, let’s explain what we do know about the top 20 MSAs:
93 percent of those that experienced originator expansion (or 100 percent of those with originator expansion greater than 3 percent) also enjoyed endorsement growth.
93 percent of those that experienced endorsement growth (or 100 percent of those with endorsement growth greater than 2.25 percent) enjoyed originator expansion.
The difference between the top 20 MSA collective growth (12.22 percent) and collective expansion (13.05 percent) is less than one percent (.83 percent to be precise)!
Bringing this Home: Endorsements per Originator Anytime the marketplace expands, some will fear an increased difficulty in growing or sustaining year-over-year production. With the top 20 MSAs being the most active, seeing how expansion has impacted endorsements per originator (EPO) is a good place to start testing this theory. Consider the following:
Nine of the 15 MSAs that experienced originator expansion (almost two-thirds) had an increase of EPO.
Only three of the five MSAs that experienced endorsement decrease also measured a decrease of EPO.
Nationally, the industry measured 25.35 EPO, down 1.51 from 2014 (a 5.61 percent loss).
For the top 20 collectively, the decrease was only .11, landing at 14.85 EPO (only a .74 percent loss)!
Conclusion In summary, in an industry that has been plagued with disruptions and negative messages in recent years, it is good to filter out the noise and notice positive movement. Although the correlation between originator expansion and endorsement growth isn’t totally clear at this point, we can see they are connected in a positive way. Additionally, as our industry expands, we can feel comfortable with how the endorsements per originator had negligible change in the past year, and in fact showed more consistency in markets with increased competition.


