In the last two years, private equity firms have spent more than $20 billion on single-family homes, according to a new report released Thursday by national housing activist group Right to the City Alliance entitled Rise of the Corporate Landlord: The Institutionalization of the Single Family Rental Market and its Impact on Renters.
The report, covered by HousingWire here, is critical of the rise of REO-to-rental, in which investors purchase foreclosed properties from banks and turn the properties into rental homes. The following charts measure to which extent the level of bank-held REO is dropping.
The practice has become more common in the last few years, with companies like Invitation Homes and American Homes 4 Rent buying up thousands of homes and selling residential mortgage-backed securities based on the homes mortgages. There have been four RMBS offerings from the two companies in the last two years.
Invitation Homes brought a $1 billion REO-to-rental securitization to market in May, and American Homes 4 Rent launched its first RMBS in May as well.
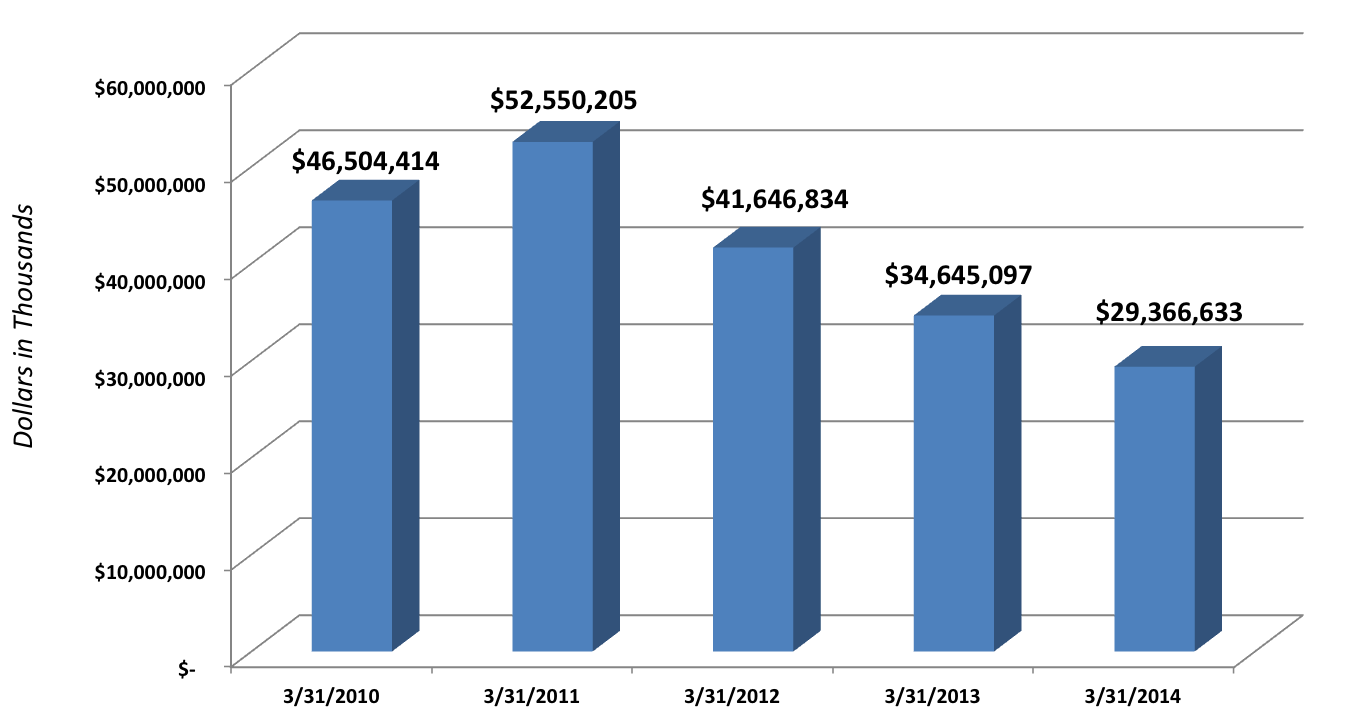
The evidence of the impact on the amount of real estate owned by banks can be seen in new data from BankDATAWORKS. According to the report, the total REO inventory held by banks has dropped from $52.55 billion in March 2011 to $29.37 billion in March 2014. That’s a drop of 44%.
Click the chart below (courtesy of BankDATAWORKS) for more information.
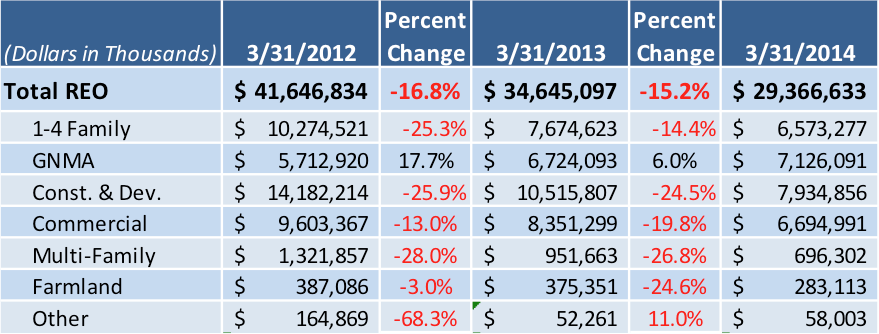
For single-family homes, the amount of REO inventory has dropped from $10.28 billion to $6.57 billion from March 2012 to March 2014. That’s a drop of 36%.
Click the chart below for a breakdown of REO inventory across various segments, i.e. single-family, commercial, multi-family and others.
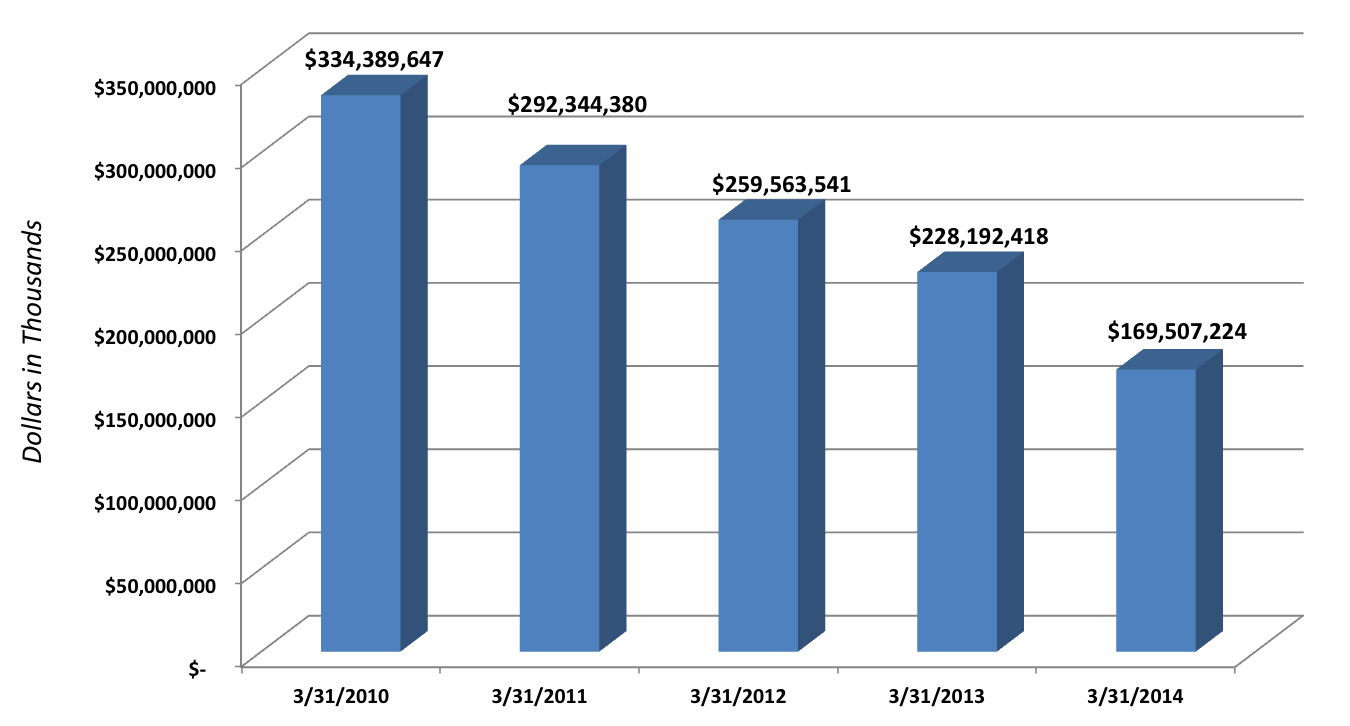
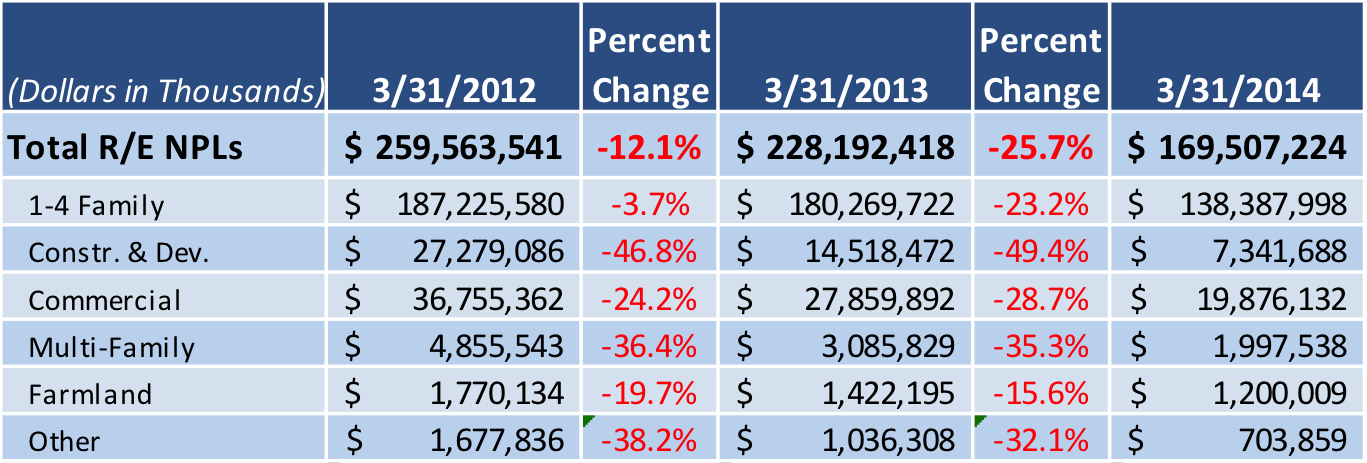
Click below to see a breakdown of the drop in non-performing loans. Spoiler alert…it's substantial.
The amount of non-performing loans held by banks has dropped even more dramatically in the last four years. In March 2010, banks held $334.39 billion in non-performing loans. That figure dropped to $169.51 billion in March 2014, which represents a drop of nearly 50%.
Click the chart below for more information.
Non-performing loans on single-family homes have dropped 26% in the last two years, from $187.23 billion in March 2012 to $138.39 billion in March 2014.
Click the chart below for a breakdown of non-performing loans by segment.
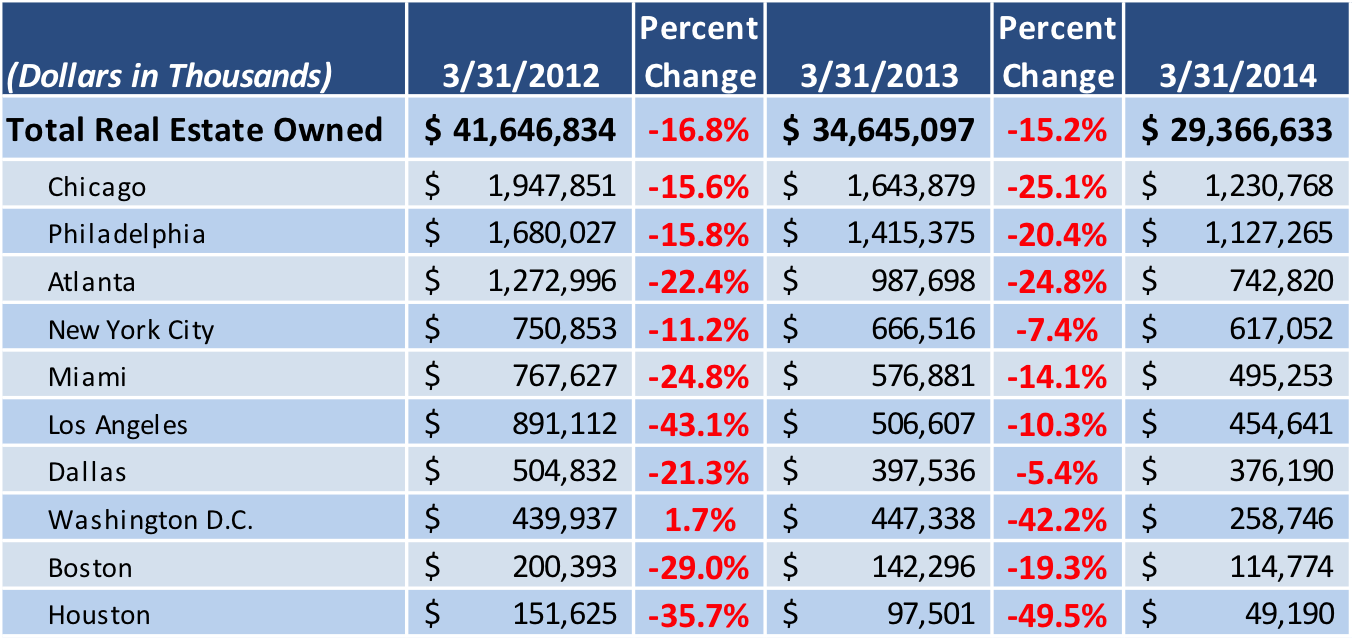
REO inventory has fallen in each of the top ten local banking markets in the last two years – in one case by 68%. In Houston, REO inventory has dropped from $151.63 million in March 2012 to $49.19 million in March 2014, a drop of 67.55%.
Of the top ten banking markets, Chicago has the most REO inventory, but the total is dropping. In 2012, there was $1.95 billion in REO inventory in Chicago. The figure has fallen to $1.23 billion in 2014, a drop of nearly 37%.
Click the chart below to see how much REO inventory as fallen in each of the top ten banking markets.
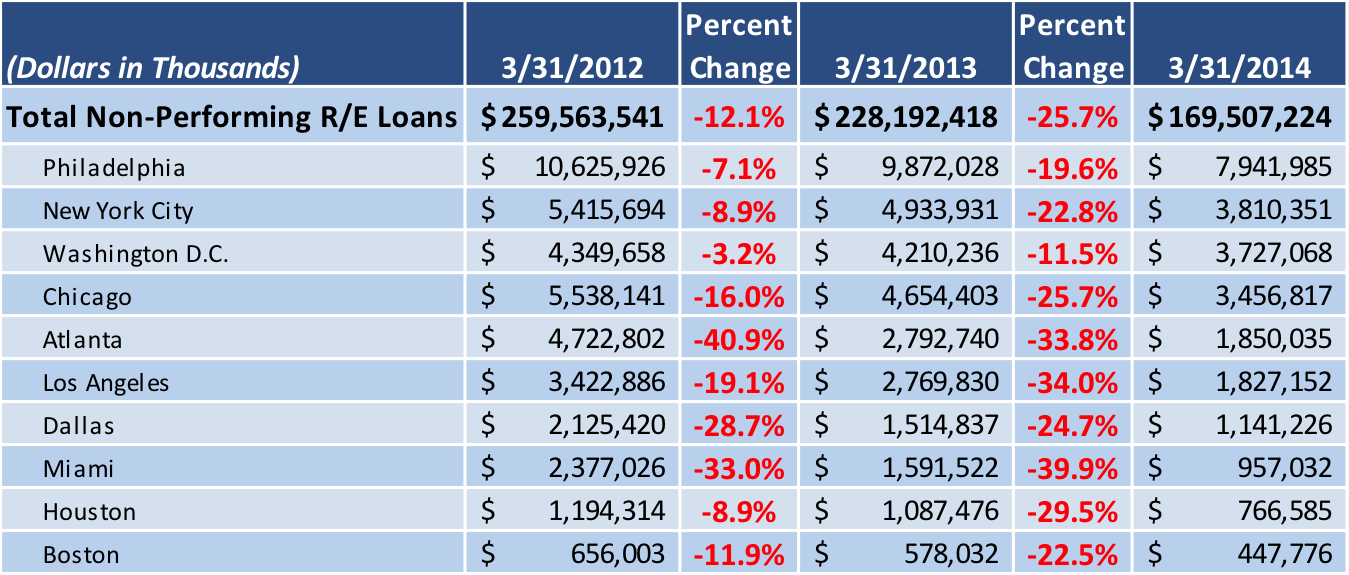
Chicago doesn’t lead the way in non-performing loans though. In fact, Philadelphia, which ranks first, has more than double the amount of non-performing loans as the next largest city, New York City.
Philadelphia had $7.94 billion of non-performing loans as of March 2014. The figure is down 25% from 2012’s total of $10.63 billion, but it still outpaces New York by over $4 billion.
New York City has $3.81 billion in non-performing loans, down 30% from $5.42 billion in 2012.
Click the image below for the full breakdown of the non-performing loan data from the top ten markets.