The Federal Reserve Board and Federal Reserve Bank presidents released its updated economic projections for changes in real GDP, unemployment rate and PCE inflation.
In addition, it updated policymakers’ assessments of the appropriate path for the Federal Open Market Committee’s target federal funds rate.
These five charts give an inside look into what the FOMC forecasts for the U.S. economy.
The source for all the charts is the Federal Reserve (click mage for larger view).
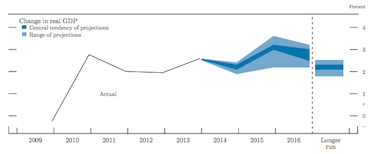
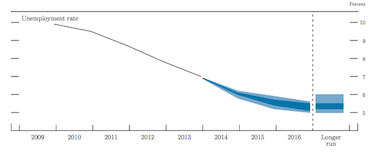
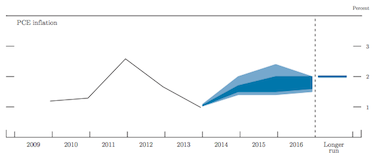
The three charts show actual values and projections based on FOMC’s participants’ individual assessments of appropriate monetary policy.
To understand the following three charts:
-Lightly shaded areas represent the rages of the projections of policymakers. The bottom of the range for each variable is the lowest of all of the projections for that year or period. Likewise, the top of the range is the highest of all of the projections for that year or period.
-Dark shaded areas represent the central tendency, which is a narrower version of the range that excludes the three highest and three lowest projections for each variable in each year or period.
– The longer-run projections, which are shown on the far right side of the charts, are the rates of growth, unemployment, and inflation to which a policymaker expects the economy to converge over time—maybe in five or six years—in the absence of further shocks and under appropriate monetary policy.
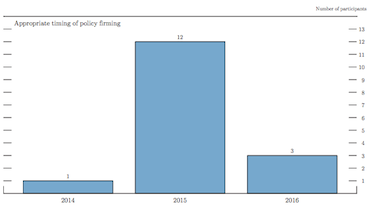
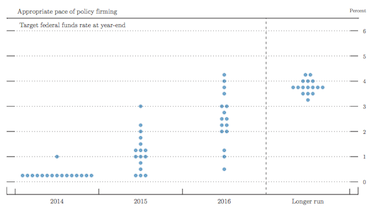
These two charts show policymakers’ assessments of the appropriate path for the FOMC’s target federal funds rate.
To understand these two charts:
-In the first one, the shaded bars show the number of FOMC participants who judge that the initial increase in the target federal funds rate (from its current range of 0 to ¼ percent) would appropriately occur in the specified calendar year.
-In the second one, the dots represent individual policymaker’s assessments of the appropriate federal funds rate target at the end of each of the next several years and in the longer run. Each dot in that chart represents one policymaker’s projection. Please note that for purposes of this chart the responses are rounded to the nearest ¼ percentage point, with the exception that all values below 37.5 basis points are rounded to ¼ percent.